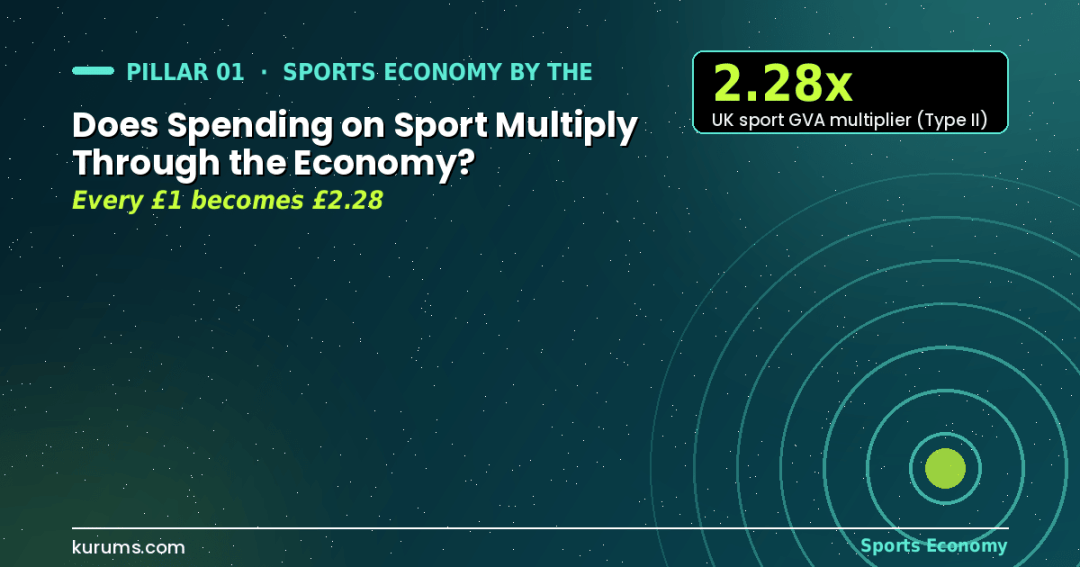
Yes, but by less than the brochures claim. Official UK input-output analysis gives sport a Type I GVA multiplier of 1.52 (supply-chain effects) and a Type II multiplier of 2.28 (adding wage-induced spending), with 0.79 extra jobs for every direct job; the UK satellite account uses a more conservative 1.55. Sport England puts the social return at £4.20 per £1 spent. Mega-event impact studies commissioned by organisers are a different matter: independent economists have repeatedly found their claims overstated by five to ten times, and WARC calculates that the 2026 World Cup lifted global ad spend by $10.5 billion, or 1.1%, against a 2.8% spike for Russia 2018.
Spending on sport is said to multiply, and the multiplier is the number that turns a stadium proposal into a political promise. Spend £1, the argument goes, and the economy gets back £2, £3 or, in the most generous consultancy decks, £7. Some of that is true: sport buys from builders, caterers, broadcasters and kit makers, and pays wages that are spent again locally. Some of it is a well-documented statistical sleight of hand that substitutes gross spending for net gain and ignores what the money would have done otherwise. This article separates the two, using the official multipliers published by UK statistical and sporting bodies, the academic record on mega-events and the 2026 figures that have emerged from the World Cup in North America. It is part of the Sports Economy hub and builds on our analysis of sport’s share of GDP and jobs, which explains how satellite accounts measure the direct effect that multipliers are then applied to.
What is a realistic sport multiplier?
Between 1.5 and 2.3 for value added and 1.4 to 1.8 for jobs, according to UK input-output analysis for UK Sport (2024) and the DCMS satellite account. Anything above 3 should be treated as a marketing figure.
Do mega-events pay for themselves?
Rarely in GDP terms. Independent studies find host-region gains a fraction of the pre-event projections, and Olympic cost overruns average well over 100% in real terms. Benefits do exist but are mostly non-monetary or long-term.
Where is the multiplier highest?
In participation and grassroots sport, which is labour-intensive, locally sourced and largely funded by household spending that would otherwise leak into imports. Sport England estimates a £4.20 social return per £1 spent.
What is the sports economic multiplier?
The multiplier is the ratio between the total economic activity generated by a pound spent on sport and the initial pound. A Type I multiplier adds supply-chain (indirect) effects; a Type II multiplier also adds the spending of wages earned (induced effects). UK sport’s Type I GVA multiplier is 1.52, its Type II 2.28.
The mechanism is ordinary Keynesian arithmetic applied through an input-output table. When a club spends £1 million on a new pitch, the contractor buys turf, drainage, labour and plant; those suppliers buy from their own suppliers; and every worker along the chain spends part of their wage in shops, restaurants and on rent. The ratio of the summed total to the original £1 million is the multiplier. The two conventions matter: Type I counts only business-to-business purchases, Type II adds household spending, and Type II is always larger and always more contestable, because it assumes the wages would not have been earned elsewhere.
The most rigorous public numbers for sport come from a May 2024 study by The Sports Consultancy for UK Sport, which applied Leontief input-output multipliers to Olympic and Paralympic sport in 2021. It found direct GVA of £25.5 billion rising to £58.2 billion once £13.3 billion of indirect and £19.5 billion of induced effects were added, giving a Type I multiplier of 1.52 and a Type II of 2.28. For employment the figures were 1.37 and 1.79: 497,521 direct full-time-equivalent jobs supporting 888,639 in total, so each direct job carries 0.79 further jobs with it. Turnover multiplied by 1.56 and 2.32.
The DCMS Sport Satellite Account for the UK, published in October 2024, uses a single, more conservative figure: each £1 of sport GVA generates a further 55p elsewhere, a multiplier of 1.55. The difference from UK Sport’s 2.28 is mostly the exclusion of induced effects, and it illustrates the first rule of reading any sport impact claim: ask which type of multiplier is being used and whether household spending is in it.
How large are the indirect and induced effects in practice?
Roughly 50–60% on top of the direct effect for supply chains, and a further 60–80% if wage spending is included. UK Sport’s 2014 footprint study found indirect effects raised Olympic and Paralympic sport’s GVA by about 58% and employment by about 63%; its 2021 study found induced effects added another £19.5 billion.
Comparing the two UK Sport studies shows how stable the supply-chain effect is. The 2014 report measured direct GVA of £18.9 billion rising to £30.0 billion with indirect effects, and 623,000 direct jobs rising to about 1,018,000; the 2021 report measured £25.5 billion rising to £38.8 billion before induced effects, and 497,521 direct FTE jobs rising to 680,615. Across seven years and a pandemic the Type I GVA multiplier stayed near 1.5, where input-output tables also put comparable service industries such as hospitality.
The induced effect is where sport looks stronger than its productivity would suggest. Because sport is labour-intensive, with 3.9% of UK jobs for 2.6% of GVA, a high share of its output goes straight into wages, and wages are spent locally. That is why UK Sport’s employment multiplier of 1.79 is close to its GVA multiplier, whereas in a capital-intensive sector such as energy the GVA multiplier is high and the jobs multiplier low. For a local authority that cares about jobs, sport’s structure is an advantage; for a treasury that cares about productivity, it is the opposite. US data agree: the BEA’s 2024 outdoor-recreation account shows supporting activities such as travel, retail and lodging make up 51.5% of the sector’s $696.7 billion of value added, more than the core activities themselves.
| Measure | Direct | + Indirect | + Induced | Type I | Type II |
|---|---|---|---|---|---|
| GVA (£bn) | 25.5 | 38.8 | 58.2 | 1.52 | 2.28 |
| Employment (FTE) | 497,521 | 680,615 | 888,639 | 1.37 | 1.79 |
| Turnover (£bn) | 75.5 | 117.9 | 175.3 | 1.56 | 2.32 |
| Share of UK economy (GVA) | 1.3% | 1.9% | 2.9% | – | – |
Olympic and Paralympic sport in the UK, 2021 data. Source: The Sports Consultancy for UK Sport, May 2024. Shares are approximate.
Why do mega-event impact studies overstate the multiplier?
Because they count gross spending rather than net new activity, ignore substitution and displacement, apply Type II multipliers to money that would have been spent anyway, and are usually commissioned by the organiser. Independent evaluations consistently find realised impacts a fraction of the forecast.
The errors are well catalogued in the academic literature on sports economics, notably by Robert Baade, Victor Matheson, Andrew Zimbalist and Stefan Szymanski. The first is substitution: a resident who buys a World Cup ticket has less to spend at the cinema, so the local economy gains the ticket and loses the film. The second is displacement, or crowding out: hotel rooms sold to football fans in Munich in June are rooms not sold to business travellers and other tourists who stay away from a congested city. The third is leakage: much of the spending flows to FIFA, the IOC, foreign broadcasters, international hotel chains and visiting sponsors rather than to local businesses. The fourth is the counterfactual: public money spent on a stadium is public money not spent on transport or schools, which have their own multipliers.
Super Bowl studies are the textbook case. Host committees have routinely claimed impacts of $300–600 million; Matheson and Baade’s peer-reviewed examinations of actual taxable sales and employment in host cities found gains closer to a tenth to a quarter of that. The Oxford study of Olympic costs led by Bent Flyvbjerg found that every Games since 1960 has run over budget, with an average real-terms overrun above 170%, the highest of any category of mega-project; benefits, meanwhile, are projected in advance and rarely audited afterwards. For a city-by-city reckoning see our articles on whether the Olympic Games pay off and what a mega-event does for a host city.
What did the 2026 World Cup show about event multipliers?
That measured effects are modest. WARC puts the tournament’s lift to global advertising at $10.5 billion, or 1.1%, less than half the relative spike of 2018, and SponsorUnited data show soccer at only 9% of host-market sponsorship, despite organiser projections in the tens of billions.
FIFA-commissioned research projected the tournament’s global economic output in the tens of billions of dollars with several hundred thousand job-years; those are gross-output figures using Type II multipliers across three countries. WARC’s independent estimate, published in March 2026, is narrower and more sober: the tournament added about $10.5 billion to global advertising spend, an inflation-adjusted lift of 1.1% over a non-tournament year, down from the 2.8% quarterly spike that Russia 2018 produced. SponsorUnited’s host-market data show the 13 US and Canadian host markets carrying about $4.5 billion of team sponsorship revenue, with $725 million of new deals in the year before the tournament, but soccer’s share of that was only 9%.
Which kinds of spending on sport have the highest multiplier?
Participation and grassroots sport, local facilities and regular domestic events. They are labour-intensive, source locally and draw on household spending that is not displaced. One-off mega-events and imported-equipment purchases have the lowest net multipliers because so much of the money leaks abroad or substitutes for other spending.
The structure of sport employment explains why. EOSE’s analysis of 2024 Eurostat data shows 40.8% of EU sport workers are part-time, 22.4% self-employed and 23.5% aged 15–24, a profile that means wages are spent quickly and locally, which is what feeds a Type II multiplier. A leisure centre spends on local staff and maintenance; a stadium build spends on steel, specialist contractors and consultants from outside the region.
Sport England’s social-value work goes further than GVA. Its latest research values the annual social benefit of sport and physical activity in England at more than £100 billion, against the sector’s £46.7 billion of GVA, and calculates a return of £4.20 for every £1 invested once health-care savings, improved wellbeing, educational attainment and reduced crime are monetised. Those are not economic multipliers in the input-output sense and should never be added to GVA figures, but they are the strongest evidence that the spending with the highest total return is at the grassroots, not the elite.
Regular domestic events sit between the two. A Premier League season, a Bundesliga season or Türkiye’s Süper Lig generates 17–19 home fixtures per club with predictable travel, hospitality and media spending, and the host city’s infrastructure is already built. Galatasaray’s €282 million of operating revenue in 2024/25 supports a supply chain of Istanbul caterers, security firms and transport operators every fortnight, which is a more reliable multiplier than a once-in-a-generation tournament. The workplace dimension, where employers fund sport for productivity reasons, is examined in our article on what corporate wellness programmes actually return.
How should the multiplier be applied to a business case?
Apply it only to net new spending, use a published Type I multiplier (about 1.5) for the central case and a Type II (about 2.3) only as an upper bound, convert to GVA and full-time-equivalent jobs, and compare against the multiplier of the alternative use of the same money.
The discipline that separates a credible case from a brochure is the counterfactual. A club seeking public support for a stadium should estimate how many visitors are new to the region, how many nights they stay, what they spend, and then subtract residents and displaced visitors before multiplying. A city bidding for an event should model the leakage: hotel chains, broadcasters and the rights holder typically take the largest share. A government funding participation should use the satellite-account figures, with sport’s 1.55 multiplier and above-average job intensity, which survive scrutiny in a way that event projections do not. Remember too that the multiplier measures activity, not benefit: sport that displaces other spending still produces real GVA and jobs, just not more than the alternative would have, so the case for public money usually rests on health, social and distributional benefits rather than a superior multiplier.
What does the evidence say about sport and long-term growth?
Sport’s long-run contribution comes through participation, health and skills rather than through event spending. Sport employment in the EU grew 52.9% between 2011 and 2024 against 10.9% for the economy, and sport’s share of UK GVA rose from 2.44% to 2.6%, but no rigorous study has found a sustained GDP boost from hosting mega-events.
The best long-run evidence is structural rather than event-based. Oliver Wyman’s modelling for the World Economic Forum projects the global sports economy growing from $2.3 trillion to $3.7 trillion by 2030, but its downside scenario removes $517 billion of that if physical inactivity and climate disruption are not addressed, which is a statement about participation, not about stadiums. The sectors with the largest shares of that total, sports tourism at $672 billion and sporting goods at $614 billion, grow with household income and leisure time, and their multipliers are those of ordinary tourism and retail.
Where hosting does appear to pay off, it is because the event was used to accelerate infrastructure that was needed anyway, as Barcelona did in 1992 and London in 2012, and the gains show up in transport, housing and regeneration accounts rather than in sport. Where it does not, as with venues left underused afterwards, the multiplier was applied to spending with no durable demand behind it. The difference is not in the arithmetic of the multiplier; it is in whether anything is still being multiplied five years later. The forecast side of that argument is set out in our article on where the sports economy is heading by 2030.
Frequently Asked Questions
What is the economic multiplier for sport?
Official UK analysis gives sport a Type I gross-value-added multiplier of 1.52, meaning each £1 of direct GVA supports a further 52p in the supply chain, and a Type II multiplier of 2.28 once the spending of wages is included. The employment multipliers are 1.37 and 1.79. The DCMS satellite account uses a single conservative figure of 1.55. Figures above 3 almost always come from event-promotion studies rather than statistical analysis.
Do the Olympics or World Cup boost a host economy?
Usually much less than forecast. Independent economists such as Baade, Matheson and Zimbalist have repeatedly found actual host gains at a fraction of pre-event projections, and Flyvbjerg’s Oxford research shows Olympic cost overruns averaging well over 100% in real terms. WARC estimates the 2026 World Cup lifted global ad spend by 1.1%, less than half the relative effect of Russia 2018. Benefits that do materialise tend to come from accelerated infrastructure rather than tournament spending.
What is the difference between a Type I and Type II multiplier?
A Type I multiplier captures direct activity plus indirect effects through the supply chain: a club buys catering, the caterer buys food, the farmer buys feed. A Type II multiplier adds induced effects, the spending of wages earned at every stage. Type II is always larger and more contestable, because it assumes those wages would not have been earned in another job. Government appraisals generally use Type I as the central case.
Is the social return on sport the same as the economic multiplier?
No. Sport England’s figure of £4.20 returned for every £1 spent, and its estimate of more than £100 billion of annual social value, monetise health-care savings, wellbeing, education and crime reduction using social-value methods. The economic multiplier measures only market activity in GVA, jobs and turnover. The two use different methods and different units and must never be added together, although both are legitimate parts of a case for public investment.
Discover more from Kurums | Business Intelligence
Subscribe to get the latest posts sent to your email.