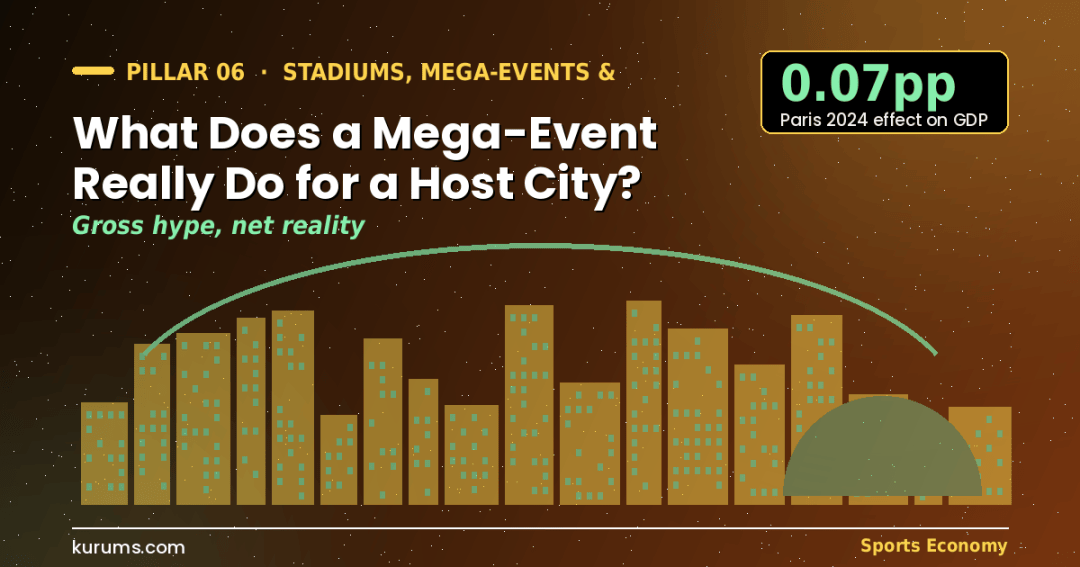
A mega-event changes a host city for a few weeks and, in most cases, barely at all afterwards. Host-committee studies report gross spending: $720 million for Super Bowl LX in the Bay Area according to BCG, $1.5 billion for the first Las Vegas Grand Prix according to Applied Analysis, €7.4 billion for Euro 2024 according to Nielsen for UEFA. Independent audits report net effects: the Cour des comptes measured Paris 2024 at 0.07 percentage points of GDP growth, Louvre attendance fell 22% during the Games, and an independent economist put the Las Vegas race’s hotel gain at $60–70 million for the weekend with occupancy down 20% earlier in the week. The gap between the two sets of numbers is displacement, leakage and opportunity cost, and it is where every host-city decision should start.
What a mega-event really does for a host city is one of the best-studied and least-heeded questions in economics. Thirty years of peer-reviewed work say the net local gain is small; thirty years of host-committee press releases say it is enormous. This article is part of the Sports Economy hub and sits alongside our analyses of whether the Olympic Games pay off and the economics of the 2026 World Cup. It uses the 2024–2026 events with the best published data to show how to read an impact claim, what actually moves in a host city’s economy, and when hosting is worth it.
Why do official impact numbers and academic numbers differ so much?
Official studies count gross visitor spending; academic studies subtract displaced tourism, money that leaks to non-local owners and the public cost. Super Bowl LX’s $720 million gross produced $20 million of local tax revenue.
Which events pay best for a city?
Those with no capital cost, a short duration and visitors who would not otherwise come: a Super Bowl or a Champions League final in a city with spare hotel capacity scores better than an Olympics with new venues.
What does a mega-event reliably deliver?
A spike in hotel rates and tax receipts, global broadcast exposure, accelerated infrastructure the city had already planned, and a measurable but temporary dip in regular tourism.
What does a mega-event host city actually gain?
A host city reliably gains four things: a short burst of high-margin hotel and hospitality revenue, a one-off rise in sales and bed-tax receipts, broadcast exposure, and a hard deadline that forces infrastructure decisions. It does not reliably gain permanent jobs, higher long-run growth or a tourism step-change.
Hotels capture the clearest benefit because they can reprice. During Paris 2024, three- to five-star rates ran 41–64% above the annual average, according to Lighthouse data cited by Oxford Economics; the 2023 Champions League final pushed Istanbul occupancy above 90% with room prices roughly doubling, according to the hotel association TÜROB. Public treasuries capture the second benefit through bed and sales taxes: Clark County reported $77 million of state and local taxes from the first Las Vegas Grand Prix, and BCG counted $20 million of local fiscal revenue from Super Bowl LX in February 2026.
Broadcast exposure is real but hard to value; the Paris data suggest the effect is smaller than destination marketers assume for cities that are already famous. The deadline effect is the most durable: London’s Stratford regeneration and Paris’s Seine clean-up happened because an immovable date focused budgets that had drifted for decades.
What a city does not gain is the headline figure. The jobs in impact studies are mostly job-weeks of temporary work expressed as full-time equivalents; the “economic activity” is gross turnover that includes residents’ spending and revenue booked by hotel chains, airlines and the event owner.
Why do host-committee studies overstate the impact?
Because they measure gross spending in the host region and skip three subtractions: displacement of visitors and residents who stay away, leakage of revenue to owners outside the region, and the public cost and opportunity cost of hosting. Each can remove a third or more of the headline.
Displacement is the biggest and the best documented. Paris’s tourism board expected arrivals during the 2024 Games to rise 11%, but Delta’s barometer showed travel volume to the city down nearly 15% in July against 2023, hotels cut rates to fill rooms, the Louvre’s attendance fell 22% and the Musée d’Orsay’s 29% during the Olympic fortnight, and Air France-KLM cut its third-quarter unit revenue forecast by about €20 million. The Cour des comptes concluded that regular tourism was partly crowded out. The same effect appeared in Las Vegas: Berry College economist Frank Stephenson found hotel occupancy down about 20% on the Monday to Wednesday before the 2023 Grand Prix and only 3% higher on race day, which left a weekend hotel-revenue gain of $60–70 million against the $1.5 billion in the county’s report.
Leakage follows. A World Cup ticket is FIFA revenue; a Formula 1 hospitality package is Liberty Media revenue; a Super Bowl suite is NFL revenue. Impact studies count every dollar spent in the region as if it stayed there.
Opportunity cost is the subtraction almost no official study makes. Vancouver’s roughly $578 million for seven 2026 World Cup matches, Toronto’s $380 million for six and the Bay Area’s public security bill for Super Bowl LX were all money that could have funded something else. Economist Victor Matheson, quoted by Newsweek in June 2026, described host-committee revenue estimates as promotional material rather than analysis, and the academic literature surveyed by Bradbury, Coates and Humphreys in 2023 reaches the same verdict across more than 130 studies.
| Event | Official impact claim | Independent or audited measure | Public cost |
|---|---|---|---|
| Paris 2024 Olympics | Up to €10.7bn (2016 CDES study) | +0.07pp GDP growth; €294m tax receipts (Cour des comptes) | €6.6bn |
| Las Vegas Grand Prix 2023 | ~$1.5bn (Applied Analysis for Clark County) | $60–70m race-weekend hotel gain; occupancy down 20% earlier in week (Stephenson) | $40m county investment |
| Euro 2024, Germany | €7.4bn total impact (Nielsen for UEFA) | €2.1bn direct, 44% of ticket holders foreign; ~0.1% GDP (ifo) | Existing stadiums; security and transport |
| Super Bowl LX, Bay Area 2026 | $720m activity (BCG for host committee) | $20m local fiscal revenue | Security and transit, unpublished total |
| 2026 World Cup, Canada | C$3.8bn GDP (FIFA / WTO) | Net benefit “uncertain” after public cost (PBO) | ~$1.07bn for 13 matches |
| Champions League final, Istanbul 2023 | ~$120m revenue (TÜROB) | Occupancy over 90%, rates roughly doubled, record airport movements | Existing stadium; security |
How do single-day and short events compare with the Olympics and World Cup?
Short events in cities with spare capacity perform best on a net basis: no venues to build, a few days of peak pricing and visitors concentrated on a weekend. Super Bowl LX, the Ryder Cup at Bethpage and the Istanbul Champions League final all fit that profile; multi-week tournaments with new venues fit it worst.
Super Bowl LX on 8 February 2026 is the model case. BCG’s study for the Bay Area Host Committee, released in June 2026, counted about $720 million of economic activity, split $425 million for San Francisco, $195 million for Santa Clara County and $100 million across the wider region, with $20 million of local government revenue. The event used Levi’s Stadium, already built and financed, and lasted a week. Even on the gross figures, the return on a public outlay confined to policing and transit is far better than any Olympics can show.
The 2025 Ryder Cup at Bethpage Black tells the same story at smaller scale. The Long Island Association projected $160 million for the local economy, New York State put the statewide figure above $200 million, and the Long Island Rail Road reportedly earned $20 million of extra fares. The course is a public park, so capital cost was limited to temporary infrastructure, while ticket revenue of just under $125 million on one estimate flowed to the PGA of America and Ryder Cup Europe. That split, public infrastructure and private event income, is the standard shape of a modern mega-event.
What did the Champions League final do for Istanbul?
It delivered roughly $120 million of visitor revenue in three days with no capital cost, according to the hotel association TÜROB, which makes the 2023 final one of the most efficient mega-events on record and the template for Türkiye’s Euro 2032 co-hosting with Italy.
Roughly 70,000 ticket holders spent $1,200–2,000 each against a typical Istanbul tourist’s $950, hotel occupancy passed 90% with room rates nearly doubling, and Istanbul Airport recorded its busiest day ever with 1,749 movements the day after the match, plus 214 private-jet operations over the week. The venue was the existing Atatürk Olympic Stadium, so the public cost was confined to security and transport. The weakness is the one all short events share: the spike lasted a weekend, and the black-market ticket prices of up to $11,900 reported by Hürriyet Daily News show that much of the surplus was captured by resellers rather than the city.
Does the infrastructure legacy justify the cost?
Only when the infrastructure was already needed and the event merely set the deadline. London 2012’s Olympic Park, now drawing over 20 million visits a year with 33,000 homes planned by 2036, is the positive case; Rio’s abandoned venues and Qatar’s dismantled Stadium 974 are the negative one.
The London evidence is the strongest in favour of hosting. The Queen Elizabeth Olympic Park media pack for 2025 records more than 20 million visits a year, over £600 million of mayoral investment in the East Bank cultural district, institutions including UCL East, the London College of Fashion, Sadler’s Wells East and the V&A East Storehouse opened between 2023 and 2025, a target of 40,000 jobs on and around the park by the mid-2030s and an estimated £1.5 billion for the local economy. Stratford was a regeneration site before the bid; the Games compressed 30 years of planning into seven.
Paris attempted the same in Seine-Saint-Denis. The athletes’ village is becoming housing for about 6,000 residents, the aquatics centre is a community pool and the €1.4 billion Seine clean-up opened public bathing sites in 2025. The Cour des comptes’ verdict was that the medium- and long-term benefits remain uncertain, which is the honest position two years out; the London results took a decade to show.
The failure cases share a feature: venues built for the event rather than the city. Rio’s 2016 venues, several now unused, cost $23.6 billion in 2022 prices on the Oxford Olympics Study’s measure; South Korea, South Africa and Brazil built World Cup stadiums that found little use afterwards. Brisbane 2032’s new 63,000-seat stadium will face the same test in 2040. For how such venues are paid for, see our guide to stadium financing.
How should a city measure the mega-event host city effect properly?
Use audited, ex-post data rather than ex-ante projections: bed-tax and sales-tax receipts, STR hotel data for the event window and the shoulder weeks, airport movements, and a comparison with the same period in a non-event year. Then subtract the published public cost. The Cour des comptes and Canada’s PBO show the method.
The French audit is the benchmark. It counted €3.02 billion of organisation and security spending and €3.63 billion of infrastructure across every ministry, set them against €293.6 million of tax and commercial receipts and an OCOG surplus of €75.7 million, and estimated the GDP effect from the national accounts rather than a multiplier model. Canada’s PBO did the equivalent ex ante for the 2026 World Cup, consolidating federal, provincial and municipal commitments into a single $1.07 billion figure, and declined to claim a net benefit.
Hotel data give the fastest read: occupancy and average daily rate for the event week versus the same week a year earlier, plus the two weeks either side, show both the spike and the displacement. Stephenson’s Las Vegas analysis is a template any city economist can replicate from public data.
What a city should not do is cite a figure produced by the event owner or the host committee as evidence. FIFA’s $40.9 billion global GDP claim for the 2026 World Cup, Applied Analysis’s $1.5 billion for the Las Vegas race and Nielsen’s €7.4 billion for Euro 2024 are marketing inputs; they may be accurate as gross turnover and still say nothing about net benefit. The tourism-wide context for these numbers is in our guide to the sports tourism industry, and the multiplier debate in our analysis of whether sport spending multiplies through the economy.
When is hosting a mega-event worth it for a city?
When the venues exist, the public cost is capped and funded by a dedicated revenue source, the city has spare hotel capacity in the event window, and the infrastructure the event accelerates was already in the capital plan. Vancouver’s hotel tax, Super Bowl LX and the Istanbul final meet most of those tests; Milan Cortina 2026, with a €310 million organising deficit, met few.
The venue test is binary: if hosting requires a permanent stadium the city would not otherwise build, the Oxford overrun data and the Rio and Qatar legacies apply, and the net case almost never closes. The funding test is about who pays: Vancouver’s temporary hotel tax, expected to raise about $230 million through 2030 against a city share of $246–276 million, is a model because it charges the visitors who benefit. The capacity test explains why Las Vegas, with 150,000 hotel rooms, can absorb a Grand Prix or a Super Bowl with modest displacement while Paris, already near capacity in summer, could not.
Finally, the honest test is the alternative. A city with $500 million can host six World Cup matches or fund a decade of transit improvements and small-business programmes. The academic evidence says the second usually wins on net local income; the political evidence says the first usually wins the vote.
Frequently Asked Questions
What is the “crowding out” effect in mega-event economics?
It is the loss of regular visitors and residents’ spending that an event displaces. During Paris 2024, travel volume to the city fell nearly 15% in July against 2023, the Louvre’s attendance dropped 22% and the Musée d’Orsay’s 29%, and hotels cut rates in the run-up as regular tourists avoided the crowds and prices. Impact studies that count only the spending of event visitors miss this loss, which is why audited net effects are far smaller than gross claims.
How much did Super Bowl LX generate for the Bay Area?
Boston Consulting Group’s study for the Bay Area Host Committee, released in June 2026, estimated about $720 million of economic activity from the February 2026 game at Levi’s Stadium: $425 million in San Francisco, $195 million in Santa Clara County and $100 million across the wider region. Local governments collected about $20 million in fiscal revenue. The figure is a gross measure produced for the host committee and does not subtract displaced tourism or public security costs.
Was the Las Vegas Grand Prix worth $1.5 billion to the city?
Clark County’s report, using Applied Analysis data, put the debut race’s impact at close to $1.5 billion with $77 million of state and local taxes. Independent economist Frank Stephenson found hotel occupancy down about 20% in the days before the race and only 3% higher on race day, implying a weekend hotel-revenue gain of $60–70 million. Both can be true: the gross turnover was large, but the net gain after displacement was a fraction of the headline.
Which mega-event has the best documented legacy?
London 2012. The Queen Elizabeth Olympic Park reports more than 20 million visits a year, the East Bank cultural district has attracted over £600 million of mayoral investment and new campuses for UCL and the London College of Fashion, and the legacy corporation targets 33,000 homes and 40,000 jobs on and around the park by the mid-2030s. The lesson is that the regeneration was planned before the bid; the Games provided the deadline and the political cover.