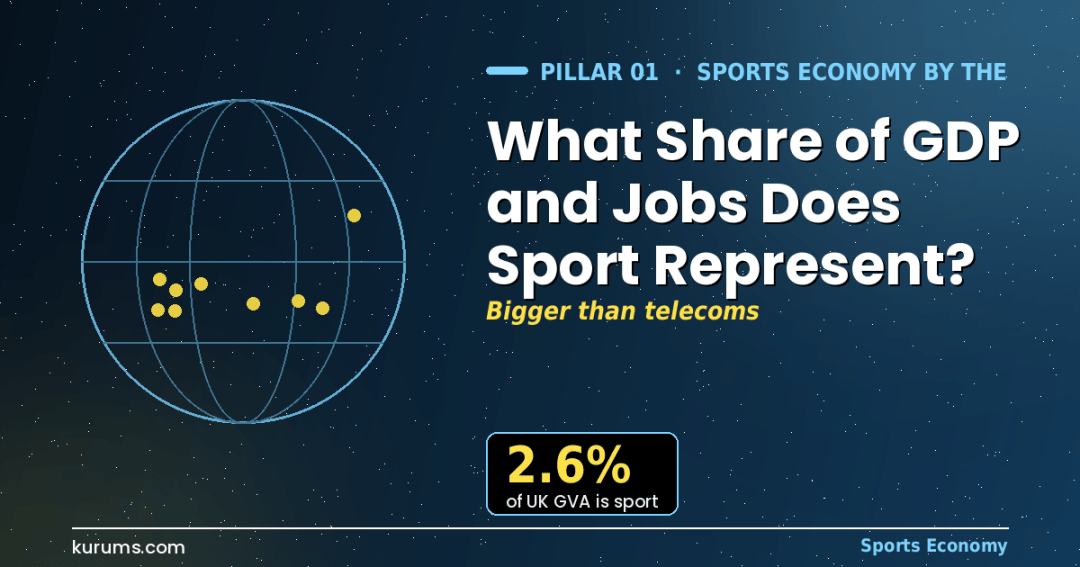
Measured properly through a satellite account, sport is worth about 2–3% of GDP and 1–4% of jobs in a rich economy. The UK’s account puts sport at £53.6 billion of gross value added, 2.6% of the total, and 1.25 million jobs, 3.9% of employment; DCMS’s provisional 2024 update raises the direct contribution to £63.2 billion and 1.3 million filled jobs. The EU-wide study puts sport at 2.12% of GDP and 2.72% of jobs on a broad definition, while Eurostat’s narrow labour-force measure counts about 1.7 million sport workers, almost 0.9% of EU employment in 2025. The US outdoor-recreation account alone is 2.4% of GDP, or $696.7 billion.
Sport’s share of GDP is a different question from how much money sport turns over, and the two are routinely confused. Turnover figures count every ticket, shirt and broadcast fee, often twice; GDP figures count only the value added at each stage, net of inputs, and they are produced by statistical offices rather than consultancies. The result is that sport, which generates headlines about trillion-dollar markets, contributes a few percent of national output, which is still larger than several industries that get far more attention from finance ministries. This article sets out the official figures country by country, explains what a sport satellite account is, and shows where the numbers diverge. It belongs to the Sports Economy hub and is the companion to our estimate of how big the global sports industry is in 2026, which approaches the same question from the revenue side.
How much of GDP is sport?
About 2.6% of UK gross value added (£53.6 billion in the 2024 satellite account), 2.12% of EU GDP in the Commission’s EU-wide study and 2.4% of US GDP for outdoor recreation alone. Narrow definitions give 0.3–1%; broad ones 2–4%.
How many jobs?
1.25–1.3 million in the UK (3.9% of employment), roughly 1.7 million on Eurostat’s narrow EU measure (almost 0.9%), or 5.67 million (2.72%) when the whole sport-related supply chain is counted.
Why do the figures differ?
Because “sport” can mean sports clubs and gyms (narrow), or everything from sportswear factories to sports broadcasting (broad). Satellite accounts exist precisely to make those boundaries explicit.
What share of GDP does sport represent?
In advanced economies sport contributes roughly 2–3% of GDP on a broad definition and well under 1% on a narrow one. The UK’s official satellite account records 2.6% of gross value added; the European Commission’s EU-wide study found 2.12% of GDP; the US outdoor-recreation account alone is 2.4%.
The best-documented national figure is British. The Sport Satellite Account for the UK, published by the Department for Culture, Media and Sport in October 2024 and built by Sheffield Hallam University’s Sports Industry Research Centre with Sports Economics Austria and Econmove, measured sport-related gross value added at £53.6 billion for 2021, or 2.6% of the UK total, on direct output of £99.6 billion. That share had risen from 2.44% in 2016 and 2.48% in 2019, and sport-related GVA fell only 2% in real terms through the pandemic against a 7% fall for the economy as a whole. DCMS’s provisional estimate for 2024, published in February 2026, raises the direct contribution of the wider sport sector to £63.2 billion, although it also records that sport GVA was flat in 2024, down 0.3%, while the DCMS sectors overall grew 2.6%.
For the European Union, the reference point is still the Commission’s study of the economic impact of sport through sport satellite accounts, which found that sport accounted for 2.12% of EU GDP, or €279.7 billion, using 2012 data on the broadest “Vilnius” definition. Sport services narrowly defined were 0.33% of GDP and sport-related education another 0.39%; the remainder came from goods, media, tourism and other connected activity. Austria, Germany, Poland and France were named as the member states deriving the largest economic benefit.
The United States has no single sport satellite account, but the Bureau of Economic Analysis publishes an Outdoor Recreation Satellite Account that overlaps heavily with participation sport. Its March 2026 release put outdoor recreation at $696.7 billion of value added in 2024, 2.4% of GDP, with real growth of 2.7%, almost exactly in line with the economy. Within it, festivals, sporting events and concerts contributed about $18.4 billion and field sports $6.5 billion.
What is a sport satellite account and why does it matter?
A sport satellite account is a statistical framework, built alongside the national accounts, that isolates the sport-related part of every industry so that value added and jobs can be measured without double counting. It is the only method that produces a figure comparable with GDP shares for other sectors.
National accounts classify activity by industry, and sport is not an industry in the usual sense. A sports club is in “sports activities”; a stadium builder is in construction; Nike’s trainers are in footwear manufacturing; Sky’s football coverage is in broadcasting; the physiotherapist who treats a rugby player is in health. A satellite account goes through each of those industries and estimates the share that exists because of sport, then adds them up. The European approach, agreed by statisticians at a 2007 meeting in Vilnius, defines three tiers: a statistical definition (the sport industry classification itself), a narrow definition (everything needed to produce sport, from equipment to coaching) and a broad definition (the narrow set plus everything that uses sport as an input, from sports media to sports betting).
The choice of tier changes the answer by a factor of six or more. In the UK account, sport-related GVA under the full broad definition is £53.6 billion; the share of that attributable to passive consumption such as watching sport is only 13%, with 87% coming from active sport, meaning participation, facilities, equipment and coaching. Readers who hear “sport is 2.6% of the economy” and picture the Premier League are looking at the wrong 13%. The payoff is comparability: Sheffield Hallam’s team noted that the UK’s £53.6 billion sport GVA exceeded building construction (£40.2 billion), food and beverage services (£36.5 billion) and telecommunications (£33.3 billion).
How many jobs does sport support?
About 1.25–1.3 million in the UK, 3.9% of all employment; roughly 1.7 million people in EU sport occupations and organisations, almost 0.9% of EU employment in 2025; and 5.67 million, or 2.72%, when the full EU sport-related supply chain is counted.
The UK satellite account counted about 1.25 million direct sport-related jobs in 2021, equivalent to 878,000 full-time positions (3.5% of UK FTE employment), paying £34.8 billion in wages, 3.1% of all UK wages. DCMS’s 2024 employment release records 1.3 million filled jobs in the wider sport sector. Because sport’s job share (3.9%) is well above its GVA share (2.6%), the sector is labour-intensive and relatively low-paid on average, a pattern repeated in every country that measures it.
The EU figures illustrate the definitional gap better than any other dataset. EOSE’s 2024 fact sheet, compiled from Eurostat labour-force data, counts 1.64 million people in sport employment across the 27 member states, 0.79% of total employment, made up of about 1.0 million people in sport and fitness occupations and 1.17 million working in organisations whose main business is sport, with the overlap removed. Sport employment has grown 52.9% since 2011 against 10.9% for the wider economy. A data story published by the EU’s open-data portal in October 2026 updates the headline to more than 1.7 million workers and almost 0.9% of employment in 2025, with Sweden highest at about 1.6%, followed by Denmark, Finland and Spain, and Romania lowest at about 0.2%. Italy, Spain and France together account for 61% of EU sport employment. The Commission’s satellite-account study, by contrast, counted 5.67 million sport-related jobs, 2.72% of the workforce, because it included sportswear manufacturing, retail, media and tourism: the first figure answers “how many people work in sport?”, the second “how many jobs depend on sport?”.
| Economy | Measure | Value | Share | Jobs | Source, year |
|---|---|---|---|---|---|
| United Kingdom | Sport GVA, broad definition | £53.6bn | 2.6% of GVA | 1.25m (3.9%) | DCMS SSA, 2021 data |
| United Kingdom | Wider sport sector, direct GVA | £63.2bn | n/a | 1.3m filled jobs | DCMS, 2024 provisional |
| United Kingdom | Olympic and Paralympic sport, total GVA incl. multipliers | £58.2bn | 2.9% | 888,639 FTE (3.4%) | UK Sport / TSC, 2021 data |
| European Union | Sport-related GDP, broad definition | €279.7bn | 2.12% | 5.67m (2.72%) | European Commission SSA study, 2012 data |
| European Union | Sport employment, labour-force definition | n/a | n/a | 1.7m (almost 0.9%) | Eurostat via data.europa.eu, 2025 |
| United States | Outdoor recreation value added | $696.7bn | 2.4% of GDP | +1.1% growth | BEA ORSA, 2024 data |
| Denmark | Sport sector turnover | DKK 13.2bn | n/a | 45,702 jobs; 16,725 FTE | Statistics Denmark, 2024 |
Which countries have the largest sport economies relative to GDP?
Among economies that publish comparable data, the UK (2.6% of GVA) and the Nordic countries (Sweden’s sport employment share of about 1.6% is the EU’s highest) rank at the top, with the United States close behind on recreation measures. Eastern European members such as Romania sit far lower.
The spread inside the EU is wide. Sport employment ranges from below 0.3% of the national workforce in some member states to above 1% in others, according to EOSE, and the October 2026 data story shows Sweden at about 1.6%, with Denmark, Finland and Spain next and Romania, Bulgaria and Czechia below the average. That ordering tracks participation: 71% of Finns and 60% of Dutch adults exercise several times a week against an EU average of 38%, while Romania, Bulgaria and Portugal are below 25%.
Germany is the largest sport economy in continental Europe in absolute terms, and the GWS institute in Osnabrück maintains a German sport satellite account covering 2010 to 2019 on behalf of the federal government. PwC’s September 2026 German sports market analysis expects the market to grow about 8.4% a year to 2030, faster than the 7.4% global figure, driven by fan-economy models, women’s sport and minority-stake investment within the constraints of the 50+1 rule, a structure examined in our Germany playbook. Türkiye publishes no satellite account, so its sport economy must be inferred from club data: Football Benchmark puts Galatasaray’s 2024/25 operating revenue at €282 million and Fenerbahçe’s at €221 million, with staff costs absorbing 63–82% of revenue at the big three, a reminder that professional sport’s GDP contribution is largely the wages it pays. See our Türkiye sports economy playbook.
Is sport’s share of the economy growing or shrinking?
Growing slowly in share and strongly in jobs. The UK’s sport GVA share rose from 2.44% in 2016 to 2.6% in 2021, EU sport employment has grown 52.9% since 2011 against 10.9% for the whole economy, and its share of EU jobs climbed from about 0.6% to almost 0.9%. The 2024 UK figure was flat.
The long-run trend is unambiguous. Sport employment in the EU has grown roughly five times faster than total employment since 2011, lifting its share by 0.22 percentage points, and the 2026 data story shows the share still rising in 2025. In the UK, sport’s resilience through 2020–21, when its GVA fell 2% against the economy’s 7%, meant its share rose during the pandemic even as absolute output dipped. In the United States the BEA’s real-output index for performing arts, spectator sports and museums reached 109.5 in 2025 against a 2017 base of 100. The short run is less flattering: DCMS’s provisional 2024 figures show sport GVA down 0.3% while the UK economy grew 1.0%, and EOSE reports nine EU member states with fewer sport workers in 2024 than in 2019, suggesting the post-pandemic rebound has run its course.
Why is sport’s job share higher than its GDP share?
Because sport is labour-intensive and pays below-average wages: coaching, fitness instruction, stewarding and retail employ many people per pound of output. In the UK, sport is 3.9% of jobs but 2.6% of GVA and 3.1% of wages; in the EU, 40.8% of sport workers are part-time against 18.8% across all sectors.
The EU labour-force data describe the workforce clearly. Workers aged 15–24 make up 23.5% of sport employment versus 8.0% across the economy, and under-30s are 36% of sport workers against 18% of all workers; in Denmark, Finland and Sweden more than 47% of the sport workforce is under 30. Part-time work is 40.8% (18.8% economy-wide), self-employment 22.4% (13.7%) and 8.4% of sport workers hold more than one job, double the general rate. Women are 43.8% of the sport workforce but only 32.4% of managers in sport organisations, and more than half of women in sport work part-time. A young, part-time, seasonal workforce generates many jobs per unit of value added, which is why sport is attractive as an employment policy, and the UK account’s GVA multiplier of 1.55 (1.79 for employment in the Olympic and Paralympic study) means those jobs pull further employment behind them, as examined in our article on whether spending on sport multiplies through the economy.
How do sport’s GDP figures compare with the “trillion-dollar” market estimates?
They are far smaller because they measure value added, not spending. The Oliver Wyman and WEF estimate of a $2.3 trillion global sports economy counts gross consumer spending; the UK’s 2.6% of GVA counts the income sport generates after paying for inputs. Both are valid; neither can be substituted for the other.
A worked example shows the difference. A £100 football shirt counted at retail contributes £100 to a market-size estimate. In a satellite account the same shirt contributes the retailer’s margin, the distributor’s margin, the brand’s design and marketing value and the share of manufacturing that happened domestically, typically £40–50 of GVA once imported fabric, energy and transport are stripped out, and much less if the shirt was made abroad. Multiply that across the sector and a $2.3 trillion spending figure corresponds to perhaps $1 trillion of value added worldwide, which, against global GDP of roughly $110 trillion, is in the same 1–2% range as the national satellite accounts. Satellite accounts also exclude social value: Sport England puts the annual social value of sport and physical activity in England above £100 billion, against £46.7 billion of GVA, with a return of £4.20 per £1 invested, which is why health ministries now fund participation, a theme explored in our article on workplace sport and productivity.
Frequently Asked Questions
What percentage of GDP is sport in the UK?
About 2.6% of gross value added, or £53.6 billion, according to the Sport Satellite Account for the UK 2024, which uses 2021 data and the broad European definition of sport. DCMS’s provisional 2024 estimate puts the wider sport sector’s direct GVA at £63.2 billion, supporting 1.3 million filled jobs. On a narrow definition covering only sports clubs, facilities and fitness, the share would be well below 1%.
How many people work in sport in the European Union?
Roughly 1.7 million people in 2025, almost 0.9% of EU employment, on Eurostat’s labour-force definition, which counts sport and fitness occupations and employees of sport organisations. The Commission’s satellite-account study, which includes the whole sport-related supply chain from sportswear factories to sports media, counted 5.67 million jobs, or 2.72% of the workforce. Sweden has the highest share at about 1.6%; Romania the lowest at about 0.2%.
Does the United States measure sport’s contribution to GDP?
Not as a single sport satellite account. The Bureau of Economic Analysis publishes an Outdoor Recreation Satellite Account, which put outdoor recreation at $696.7 billion, or 2.4% of GDP, in 2024, including boating, RVing, hunting, snow sports and field sports. Spectator sport appears within the broader arts, entertainment and recreation industry statistics, whose real-output index for performing arts, spectator sports and museums reached 109.5 in 2025 (2017 = 100).
Why is sport’s share of jobs larger than its share of GDP?
Because sport is labour-intensive and pays below-average wages. In the UK sport is 3.9% of jobs but 2.6% of GVA; in the EU 40.8% of sport workers are part-time against 18.8% in the economy as a whole, 22.4% are self-employed and nearly a quarter are aged 15–24. Many coaches, instructors, stewards and retail staff are needed per pound of output, so the sector creates jobs faster than it creates value added.
Discover more from Kurums | Business Intelligence
Subscribe to get the latest posts sent to your email.