
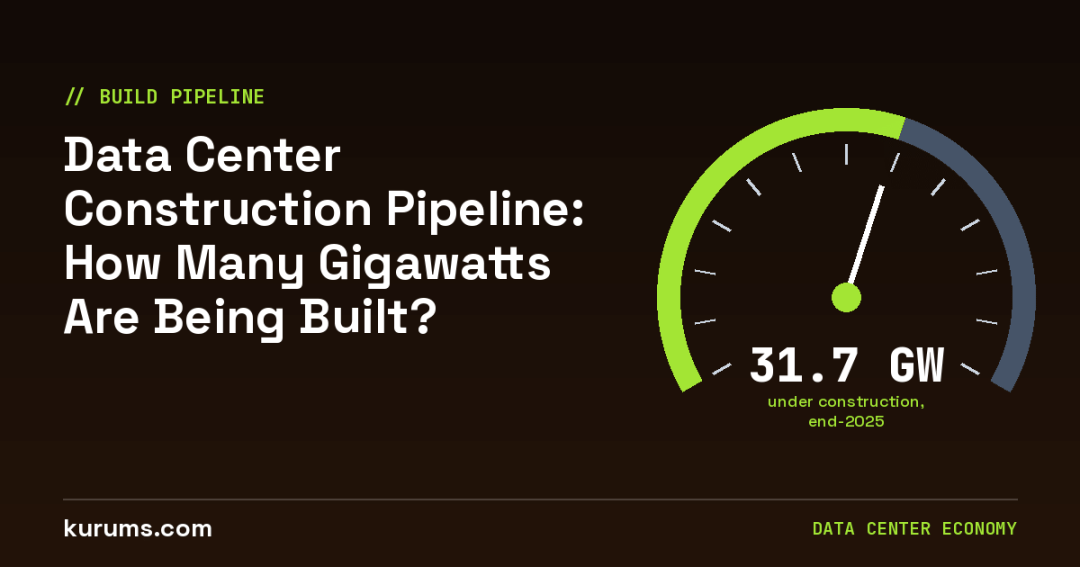
The data center construction pipeline has never been larger. Cushman & Wakefield counted 31.7 GW under construction worldwide at the end of 2025, more than double a year earlier, with about 25.3 GW (80%) in the Americas and 191.3 GW more planned there. JLL now tracks more than 66 GW under construction in North America alone on its broader measure, 95% of it committed and 77% in frontier markets. Asia-Pacific’s pipeline hit a record 26.5 GW in H1 2026. Synergy Research counts 915 hyperscale facilities in its pipeline. But delivery lags ambition: Sightline Climate expects 30–50% of the roughly 16 GW slated for 2026 to slip, and grid connections take 4–5 years.
The data center construction pipeline is the best leading indicator of where the AI build-out is heading — and of where it may stall. This article in the Data Center Economy hub compiles the latest gigawatt figures from Cushman & Wakefield, JLL, CBRE, Synergy Research Group and Sightline Climate, explains why their numbers differ, and examines preleasing, gigawatt campuses and delays. For the current state of supply, read our data center vacancy and rent statistics; for the capital behind the projects, see how data centers are financed.
How much data center capacity is under construction?
Cushman & Wakefield counted 31.7 GW globally at end-2025; JLL’s broader North American measure exceeded 66 GW by mid-2026.
Is the new capacity already leased?
Mostly. JLL says 95% of North American capacity under construction is committed, and CBRE puts primary-market preleasing at 80.4%.
Will it all be built on time?
No. Sightline Climate expects 30–50% of large projects due in 2026 to be delayed, and average grid waits for large loads run around 4.4 years globally.
How many gigawatts of data centers are under construction?
Cushman & Wakefield’s 2026 Global Data Center Market Comparison counted 31.7 GW of capacity under construction worldwide at the end of 2025, more than double the 2024 figure. JLL’s mid-2026 report puts North America alone above 66 GW on a broader definition.
The Cushman & Wakefield figure is the most consistent global benchmark because it covers the Americas, EMEA and Asia-Pacific using the same methodology. It found about 25.3 GW under construction in the Americas — roughly 80% of the world total — compared with 2.7 GW in EMEA. In Asia-Pacific, the firm’s August 2026 update counted 4.8 GW under construction.
JLL’s North America Data Center Report Midyear 2026, published in August 2026, reported more than 66 GW under construction across North America, noting that this would require more electricity than Germany consumes. That is far above JLL’s own mid-2025 figure of 7.8 GW, a gap too large to reflect one year of activity alone; the two reports evidently measure different scopes, and readers should not treat them as a like-for-like change. CBRE, which tracks only primary colocation markets, counted 7,481 MW under construction in H1 2026, up 24.8%.
Why pipeline figures differ so much
Pipeline numbers diverge because sources include different things: some count only multi-tenant colocation in established markets, others add hyperscale self-build and frontier campuses, and some add early-stage announcements. Figures may refer to critical IT load or total facility power, which differ by the cooling and electrical overhead. Always check what a number covers before comparing it with another.
Where is data center construction concentrated?
Construction is overwhelmingly concentrated in the United States. Cushman & Wakefield attributes about 80% of global under-construction capacity to the Americas, and JLL says 77% of North American construction is now in frontier markets such as West Texas, Ohio, Louisiana, Indiana and the Carolinas.
This is a major geographic shift. JLL notes that many of these frontier markets had almost no data center capacity a decade ago, while established hubs such as Northern Virginia and Santa Clara are constrained by power, land and interconnection. Among primary markets, CBRE reported that Atlanta overtook Northern Virginia as North America’s largest construction market for the first time in H1 2026, with 2,882 MW under construction (up 52.3%) versus 2,420 MW in Northern Virginia. CBRE also recorded a record 716.7 MW under construction in Dallas-Fort Worth in Q1 2026, 88% preleased.
Synergy Research’s August 2026 ranking update reinforces the trend: Texas hyperscale capacity grew 71% year on year, nearly double the 36% global average, and Indiana and Tennessee entered the global top 20 hyperscale markets. Our United States data center investment guide covers these states in detail.
| Region / market | Under construction | Planned / pipeline | Source |
|---|---|---|---|
| Global | 31.7 GW (end-2025) | — | Cushman & Wakefield 2026 |
| Americas | 25.3 GW | 191.3 GW planned | Cushman & Wakefield 2026 |
| North America (broad) | 66+ GW, 95% committed | — | JLL Midyear 2026 |
| N. America primary markets | 7,481 MW, 80.4% preleased | <1,500 MW uncommitted | CBRE H1 2026 |
| Atlanta | 2,882 MW (+52.3%) | — | CBRE H1 2026 |
| Northern Virginia | 2,420 MW (+16.5%) | — | CBRE H1 2026 |
| EMEA | 2.7 GW | 12.1 GW planned | Cushman & Wakefield 2026 |
| Asia-Pacific | 4.8 GW | 21.7 GW planned (26.5 GW total) | Cushman & Wakefield H1 2026 |
| Johor, Malaysia | 602 MW (+91%) | 3,088 MW pipeline | Cushman & Wakefield H1 2026 |
| Bangkok, Thailand | 859 MW (+148%) | 2,084 MW pipeline | Cushman & Wakefield H1 2026 |
| Sydney, Australia | — | 2,134 MW pipeline | Cushman & Wakefield H1 2026 |
| Jakarta, Indonesia | 395 MW (+112%) | 1,699 MW pipeline | Cushman & Wakefield H1 2026 |
Source: Cushman & Wakefield Global Data Center Market Comparison 2026 (2025 data) and APAC update H1 2026; JLL North America Data Center Report Midyear 2026; CBRE North America Data Center Trends H1 2026.
How large is the planned data center pipeline?
Planned capacity dwarfs what is under construction. Cushman & Wakefield counts 191.3 GW planned in the Americas and 12.1 GW in EMEA, while Asia-Pacific’s pipeline reached a record 26.5 GW in H1 2026. Market intelligence firm Currence tracks about 190 GW announced since 2024.
Planned figures should be read as intentions rather than forecasts. They include projects at every stage, from land options and utility applications to fully permitted sites awaiting equipment. Cushman & Wakefield expects Americas capacity to grow roughly sixfold if its pipeline is realised, versus just over twofold for EMEA — a measure of how much faster the Western Hemisphere is building.
In Asia-Pacific, the H1 2026 pipeline included 7.1 GW added in just six months. Johor’s combined operational and future capacity now exceeds 4 GW, and Cushman & Wakefield expects Australia, India, Japan and Malaysia each to surpass 2 GW of operational capacity by 2028. See our Asia-Pacific data center investment guide for market-by-market detail.
How many hyperscale data centers are in the pipeline?
Synergy Research Group counted 915 future hyperscale data centers in planning, development or fit-out as of August 2026, up from 535 a year earlier and 504 in early 2025. In April 2026 it said the pipeline would double hyperscale capacity within about three years.
Synergy counted 1,360 operational hyperscale facilities at the end of 2025, so the pipeline equals roughly two-thirds of the existing base by count — and far more by capacity, because new facilities are much larger. Synergy expects total hyperscale capacity to more than triple by 2031, when it forecasts hyperscale operators will hold 67% of all data center capacity worldwide, up from 48% today.
The pipeline is spread across the 21 operators Synergy tracks, including Amazon, Microsoft, Google, Meta, Oracle, Alibaba, Tencent, ByteDance and newer entrants such as CoreWeave. Our comparison of hyperscaler footprints and profile of the neoclouds cover the companies driving this growth.
What are gigawatt-scale data center campuses?
Gigawatt campuses are single sites planned for 1 GW or more of power — the scale of a large power plant. Meta’s Hyperion in Louisiana is planned for up to 5 GW, and Epoch AI tracks seven US OpenAI Stargate sites projected to exceed 9 GW combined by 2029.
Hyperion, in Richland Parish, covers a site of about 2,250 acres and is backed by a partnership with Blue Owl Capital worth at least $27 billion, announced in October 2025; utility Entergy plans at least 3.8 GW of new generation to serve it. Epoch AI’s April 2026 review of Stargate found the Abilene, Texas campus operating with about 0.3 GW toward a projected 1.2 GW, with further sites under construction in Shackelford County and Milam County (Texas), Doña Ana County (New Mexico), Port Washington (Wisconsin) and Saline Township (Michigan), each projected at 1.2–2.2 GW and targeted for late 2028. Epoch also noted OpenAI had reversed a plan to expand Abilene to 2.1 GW.
These campuses change the arithmetic of the pipeline. A single gigawatt site can account for more capacity than an entire mid-sized national market, and several rely on on-site gas generation rather than waiting for the grid. Our article on grid queues and behind-the-meter power explores why.
How much of the pipeline is preleased?
Most new capacity is spoken for before it is finished. JLL reports 95% of North American capacity under construction is committed, CBRE puts primary-market preleasing at 80.4% (up from 74.3%), and JLL’s 2026 Global Outlook estimated 77% of the global pipeline was pre-committed.
High preleasing reflects how hyperscalers now secure capacity. Rather than waiting for buildings to be finished, they sign leases — often for 100 MW or more — years ahead of delivery. JLL says most tenants signing in 2026 are contracting for 2028 deliveries, and CBRE calculates that less than 1,500 MW of future primary-market capacity remained uncommitted in H1 2026, about six months of demand at current absorption.
For developers and lenders, preleasing is crucial because it underpins financing. JLL notes construction loans for projects leased to top-tier hyperscalers can reach up to 85% loan-to-cost, while non-investment-grade tenants face wider spreads and lower leverage. For enterprise buyers, it means competing for leftover space or committing early.
How common are data center construction delays?
Delays are widespread. Sightline Climate estimated in February 2026 that 30–50% of large data centers scheduled to come online in 2026 could slip, after 26% of projects due in 2025 were delayed. JLL found more than half of 2025 projects were delayed by three months or more.
Sightline’s Data Center Outlook said at least 16 GW was planned to come online globally in 2026 across 140 projects — nearly triple the roughly 6 GW completed in 2025 — but only about 5 GW was visibly under construction, mostly in the US. About a quarter of the 2026 projects had no disclosed power plan. Sightline tracks 777 projects above 50 MW announced since January 2024, of which nine had been cancelled by early 2026.
The main bottlenecks are power and equipment. Cushman & Wakefield estimates average grid connection waits for large new loads at 4.4 years globally, 5.0 years in the Americas and 5.2 in EMEA, versus 2.7 years in Asia-Pacific. JLL reports average global equipment lead times of 33 weeks, about 50% longer than before 2020, with materials ordered up to 24 months ahead. Local opposition is a growing factor too: Sightline counted moratorium proposals in at least ten US states, and JLL’s survey found only 14% of Americans would support a data center in their community. Our guide to the data center supply chain explains equipment backlogs.
What do pipeline statistics mean for the market?
The pipeline points to sustained growth in capacity — JLL expects global capacity to nearly double to about 200 GW by 2030 — but delivery will be slower and more uneven than announcements suggest, shaped by power access, equipment supply and local politics.
For tenants, the message is that today’s tight market is likely to persist for at least two to three years, because so much new capacity is preleased. For investors, the scale of the pipeline creates both opportunity and risk: JLL estimates the build-out to 2030 could require up to $3 trillion of investment and about $870 billion of new debt. Whether demand keeps pace is the central question in our AI data center bubble debate and our market forecast to 2030.
For communities and grids, the pipeline translates into very large local footprints — power, water, land and jobs — examined in our data center water, land and jobs statistics.
Frequently Asked Questions
How much data center capacity is under construction globally?
Cushman & Wakefield counted 31.7 GW under construction worldwide at the end of 2025, more than double the previous year, with about 80% in the Americas. JLL’s broader North American measure exceeded 66 GW by mid-2026, and Asia-Pacific had 4.8 GW under construction in H1 2026. Definitions differ, so figures from different firms are not directly comparable.
Which US market has the most data center construction?
Among established primary markets, CBRE reported Atlanta overtook Northern Virginia in H1 2026, with 2,882 MW under construction versus 2,420 MW. Across all markets, JLL says 77% of North American construction is in frontier markets such as West Texas, Ohio, Louisiana and Indiana, where gigawatt-scale AI campuses are being built.
What share of data centers due in 2026 will be delayed?
Sightline Climate estimated in February 2026 that 30–50% of large projects scheduled for 2026 could be delayed. Of at least 16 GW planned for the year, only about 5 GW was visibly under construction. In 2025, 26% of 110 scheduled projects slipped, and JLL found more than half of 2025 projects were delayed by three months or more.
How long does it take to connect a data center to the grid?
Cushman & Wakefield estimates the global average wait for large new power connections at about 4.4 years, with 5.0 years in the Americas, 5.2 in EMEA and 2.7 in Asia-Pacific. JLL says waits in primary US markets can exceed four years, which is why many gigawatt campuses are building on-site gas generation.
Discover more from Kurums | Business Intelligence
Subscribe to get the latest posts sent to your email.