TL;DR:Datadog fits teams that want fast all-in-one SaaS coverage. New Relic fits consumption-style packaging (data + users/compute) with a large free tier. Grafana Cloud fits open Prometheus/OpenTelemetry stacks with a $19/mo Pro platform fee plus usage. Dynatrace fits full-stack buyers who will model host/memory-hour commits. Elastic Observability fits teams unifying search and observability on Elastic Cloud. Standardize on OpenTelemetry where you can. Fit labels are Kurums interpretation from public pricing checked 2026-09-17.
Observability platforms collect metrics, logs and traces so engineering teams can explain system behavior — not only that something is down. This guide compares five primary APM/observability products for engineering and SRE leads — not a rewrite of our cloud infrastructure management fundamentals, and not a SIEM buyer guide.
We evaluate the same fields for every option: public starting price, pricing model, hosting model, standout capability and main limitation. We do not crown a single “best overall” winner. Pricing reflects publicly listed rates checked on 2026-09-17; always verify live vendor pages before purchase.
Observability / APM tools comparison at a glance
Platform
Pricing
Best For
Link
Datadog
Infra from $15/host/mo; APM from $31/host/mo; logs from $0.10/GB
Pricing reflects publicly listed US rates as of 17 September 2026 and changes frequently. Meters differ (hosts vs GB vs users vs memory-GiB). Free tiers and allotments vary widely. Always verify current pricing on each provider’s official site. Fit labels are Kurums interpretation, not vendor rankings.
The best observability / APM platforms in 2026, compared
Datadog
Best for fast all-in-one SaaS
Best for: Teams that want broad infrastructure, APM, logs and more in one SaaS console quickly.
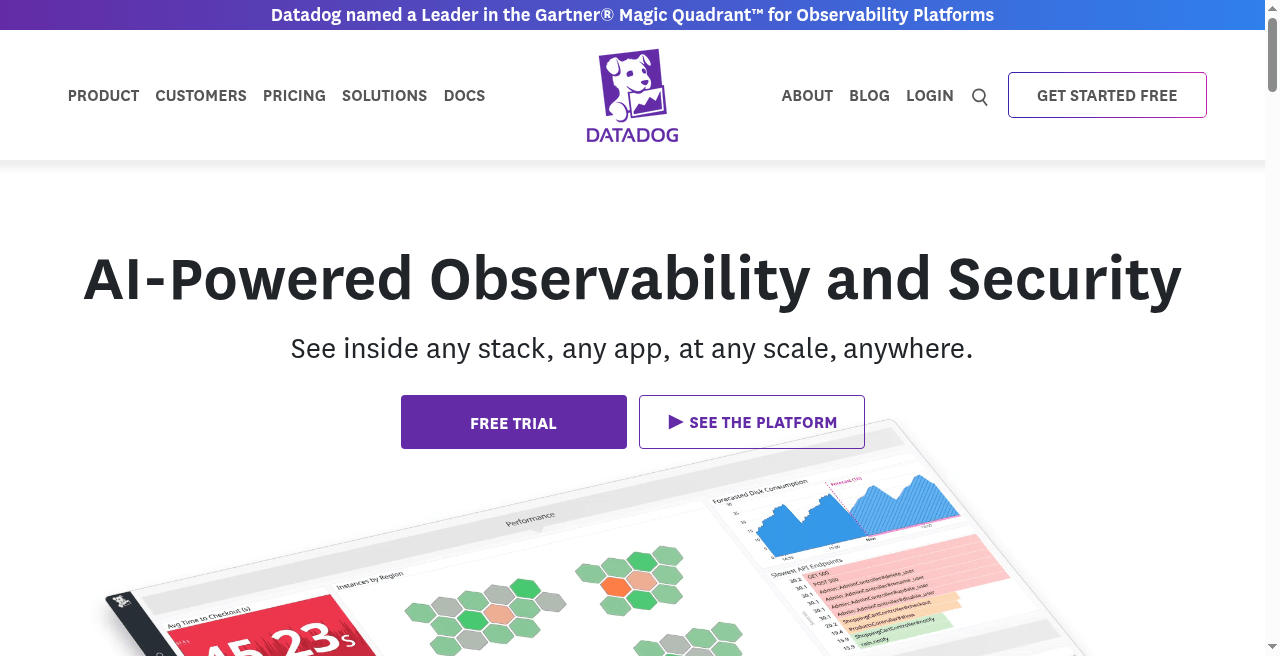
Datadog is a full-stack observability SaaS with public per-host and usage SKUs. Infrastructure Pro starts from publicly listed host rates; APM is priced per host (with or without infrastructure attached); log ingest and indexing are separate meters. OpenTelemetry export/ingest paths are documented — treat SKU sprawl and custom metrics as the main bill risks.
Starting price
Infra Pro from $15/host/mo (annual); APM from $31/host/mo with infra attached; logs ingest from $0.10/GB (verify live)
Best for: Teams that prefer data ingest + user (or compute) packaging over classic per-host APM SKUs.
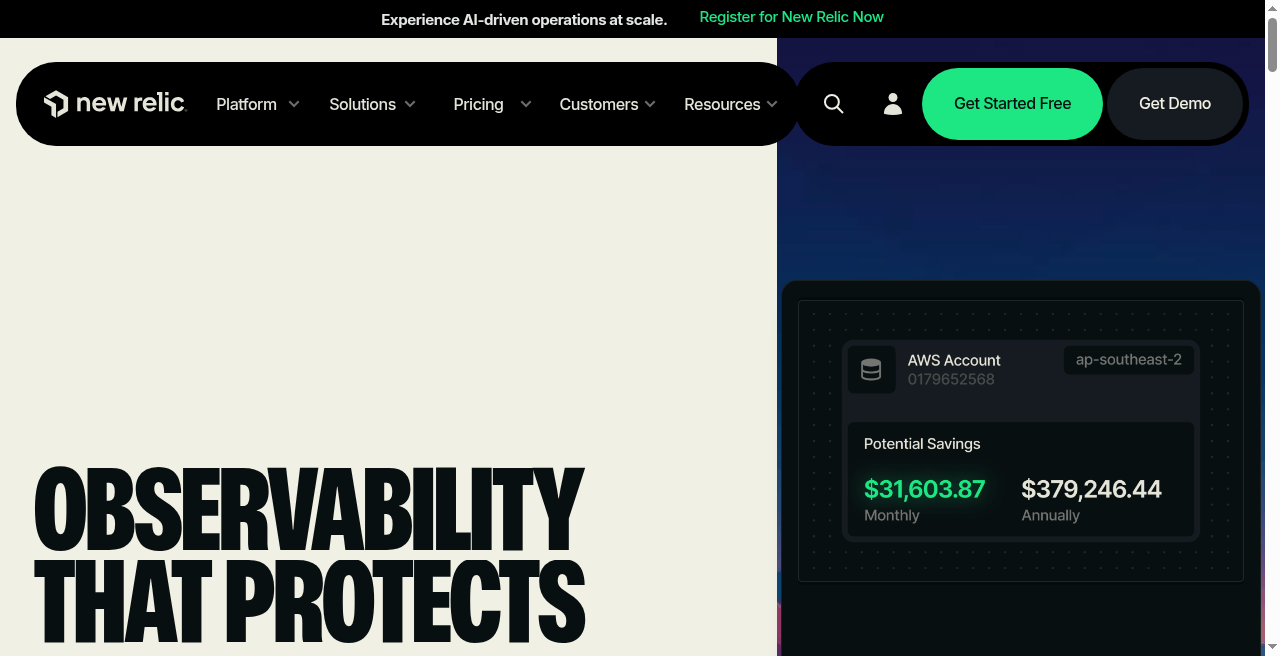
New Relic publishes a perpetual free tier (100 GB ingest/month, one full platform user, unlimited basic users) and paid editions (Standard / Pro / Enterprise) with data at $0.40/GB beyond free on the Original data option ($0.60/GB Data Plus). Full platform user prices are edition-gated on the public pricing page. Optional compute pricing paths exist — verify which model your account uses.
Starting price
Free: 100 GB/mo + 1 full platform user; paid data from $0.40/GB; Standard full users from $10 first / $99 additional (max 5) — verify live
Best for short
Consumption-style APM
Pricing model
Data ingest + users (or compute + data)
Hosting model
SaaS
Standout
Generous public free tier and non-host metering narrative
Main limitation
Full-platform user and compute add-ons decide real cost more than the $0.40/GB headline
50+ capabilities marketed on one platform — confirm which user type unlocks the workflows you need
Data Plus and Advanced Compute are optional — do not budget them by accident
Re-open newrelic.com/pricing the week you renew; edition math changes
Best for: Prometheus/OpenTelemetry-centric teams that want managed metrics, logs, traces and k6 with usage-based control.
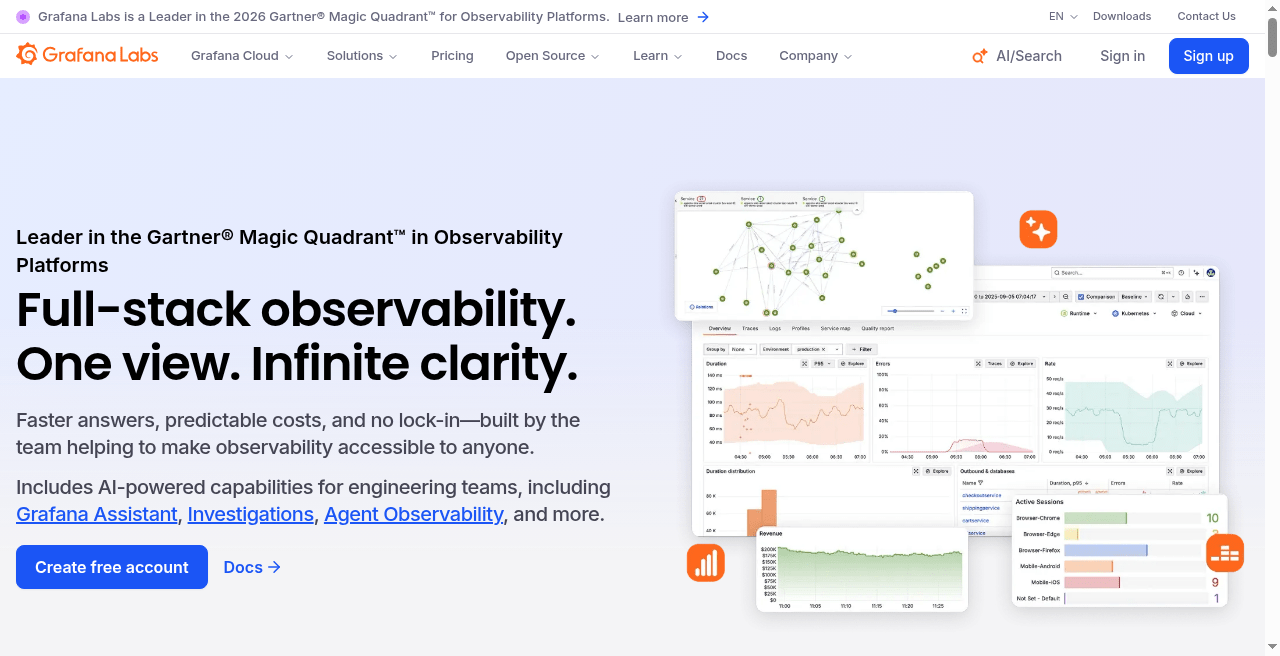
Grafana Cloud publishes Free, Pro ($19/month platform fee + usage with volume discounts) and Enterprise (from $25,000/year spend commit). Metrics, logs and traces are usage-priced; Adaptive Metrics/Logs features aim to cut unused telemetry. Strong cultural fit for teams already running Grafana OSS or OpenTelemetry collectors.
Starting price
Free tier; Pro $19/mo + usage; Enterprise from $25k/year commit
Best for short
Open metrics/logs/traces stack
Pricing model
Platform fee (Pro) + usage (series, GB, etc.)
Hosting model
Managed Grafana Cloud (or bring-your-own-cloud on Enterprise)
Standout
Native Prometheus/OTel culture with cost-control tooling
Main limitation
You still own instrumentation quality and cardinality discipline
Free tier includes limited metrics/logs/traces retention — useful for PoCs
Application Observability and Kubernetes Monitoring have host-hour options — model both paths
Enterprise commit is a different buying motion than Pro pay-as-you-go
Best for: Organizations that want Davis AI-assisted full-stack monitoring with a published host/memory-hour rate card under Dynatrace Platform Subscription.
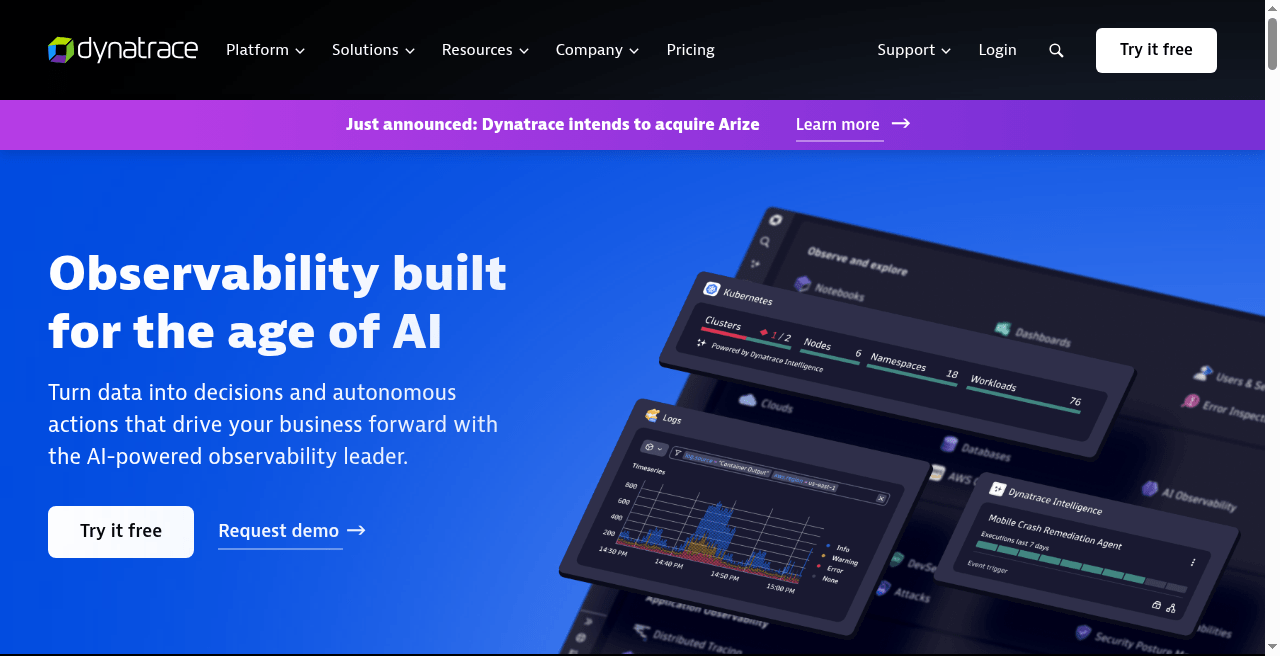
Dynatrace publishes Foundation & Discovery (~$0.01/hour/host), Infrastructure Monitoring (~$0.04/hour/host ≈ $29/mo), and Full-Stack Monitoring (~$0.08/hour per 8 GiB host ≈ $58/mo) on its public pricing page, plus separate log ingest/retain/query rates. Platform Subscription is an annual commit with rate-card drawdown — not a surprise overage premium model per Dynatrace’s FAQ.
Starting price
Full-Stack from ~$58/mo per 8 GiB host ($0.08/hour); Infrastructure from ~$29/mo/host — verify live rate card
Best for short
Full-stack host commit
Pricing model
Annual platform commit + hourly host/memory and usage rate card
Hosting model
SaaS (Dynatrace platform)
Standout
Published full-stack host pricing with automatic RCA positioning
Main limitation
Memory-GiB and add-on modules (RUM, AppSec) change the effective bill
Unlimited seats on the platform per Dynatrace pricing FAQ — cost is usage, not seat count
Best for: Teams that want logs, metrics and APM on Elastic Cloud (hosted or serverless) — especially when search/security already sit on Elastic.
Elastic prices Cloud Hosted on resources and Cloud Serverless on usage; Observability is available as a solution on both. Self-managed uses license tiers. Public pricing pages emphasize model choice over a single per-host APM sticker — use the Elastic Cloud calculator for your region and retain settings. OpenTelemetry-compatible ingest paths are documented.
Start with your instrumentation plan and who will operate the stack day to day.
Choose Datadog when you want one SaaS console across infra, APM and logs quickly and will actively govern SKUs. Price hosts + log indexing + custom metrics for a representative service before signing.
Choose New Relic when ingest + user (or compute) packaging fits your org better than per-host APM, and you will use the free tier honestly for a PoC. Confirm full-platform user counts.
Choose Grafana Cloud when Prometheus/OTel skills already exist and you want managed backends with Adaptive cost controls. Model Pro platform fee + series/GB — not “Grafana is free” alone.
Choose Dynatrace when you want full-stack host monitoring with a published rate card and will size memory-GiB correctly. Include log and RUM modules only if you will use them.
Choose Elastic Observability when logs search and observability belong on one Elastic estate (or you already run Elastic Security and accept shared platform ops).
Treat OpenTelemetry as the portability layer so vendor choice is a front-end decision, not a rewrite. Fit guidance is Kurums interpretation from public pricing and docs checked 2026-09-17 — not sponsored rankings.
Tip: Price the same representative service (N hosts or equivalent, log GB/day, trace volume, 30-day retain) on each shortlisted vendor’s public pricing page or calculator before renewing annual contracts. Cardinality and retain settings change the winner more often than feature checklists.
How we evaluate
We compare tools on the same fields: public pricing and billing basis, free plan or trial, hosting model, standout capability, and the main limitation. Order reflects evidence for common buyer situations — not affiliate availability. We do not claim “best overall,” “market leader,” or invented market share.
Primary sources are vendor pricing and documentation pages checked on 2026-09-17 (see SOURCE-LEDGER). Third-party commentary is used only for context and labeled. Re-check every price at publish time.
Frequently Asked Questions
What are the best observability tools in 2026?
It depends on your stack and metering preference. Datadog fits fast all-in-one SaaS; New Relic fits consumption packaging; Grafana Cloud fits open Prometheus/OTel stacks; Dynatrace fits full-stack host commits; Elastic Observability fits unified search + observability. There is no single best overall winner.
What is the difference between APM and observability?
APM focuses on application performance (traces, service maps, endpoints). Observability usually means metrics + logs + traces (and often profiles) so you can explain novel failures — not only known monitors. Most modern platforms sell both under one umbrella.
How much does Datadog cost?
Public list prices include Infrastructure Pro from $15/host/mo (annual), APM from $31/host/mo with infrastructure attached, and log ingest from $0.10/GB, plus indexing/retention SKUs. Real bills stack multiple products — verify datadoghq.com/pricing for your mix.
Is Grafana Cloud cheaper than Datadog?
Sometimes for Prometheus-centric workloads with disciplined cardinality; not automatically. Grafana Cloud Pro adds a $19/mo platform fee plus usage; Datadog is heavily host- and SKU-driven. Model the same telemetry profile on both public pages.
Do we need OpenTelemetry if we buy a SaaS APM?
You can use vendor agents alone, but OTel reduces lock-in and makes dual-export PoCs easier. Prefer OTel instrumentation for new services even when a SaaS backend is the short-term destination.
Observability vs SIEM — do we need both?
Often yes at scale: observability is for product/system reliability; SIEM is for security detection and compliance. Overlap exists in logs, but buyers, retention and detection use cases differ — do not force one tool to be both without a clear RACI.
How do we control log and metrics costs?
Drop low-value logs at the collector, use sampling for traces, cap custom-metric cardinality, and prefer warm/cold retain tiers for rarely queried data. Revisit retain defaults quarterly.
What should we test in an APM proof of concept?
Instrument one critical service with OTel, dual-export or sequential-trial two vendors, measure time-to-diagnose on a seeded fault, and model month-2 cost with production-like cardinality — not demo data.
Last Updated: 17 September 2026 (Europe/Istanbul) · Reviewed by the Kurums Technology editorial team. This comparison is independent and informational; it is not purchasing advice. Verify pricing, features and integrations directly with each provider.
Disclosure: Kurums comparisons are editorial and informational. “Visit” links go to official vendor sites. If a link later becomes affiliate or sponsored, it will use sponsored/nofollow attributes and this disclosure will be updated. Always verify current pricing and terms on the vendor page.