
Description
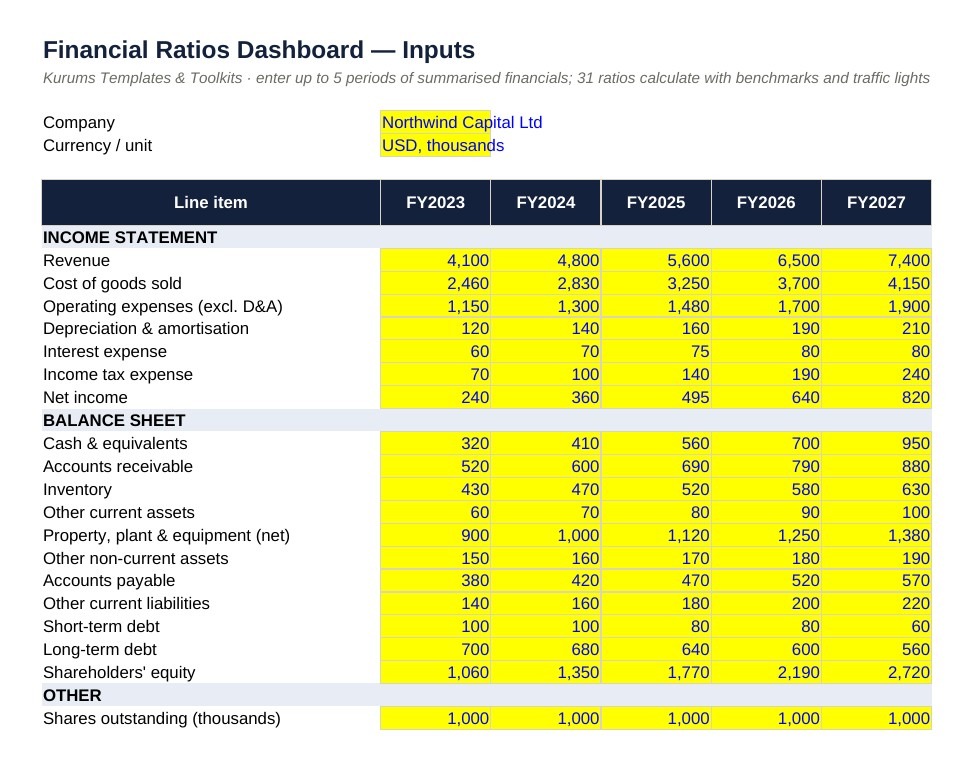
Ratio analysis is where a set of accounts turns into a story. This workbook takes 26 input lines per period (income statement, balance sheet, cash flow and share data) and produces the full ratio set an analyst, lender or board member expects — with a built-in balance check so you know the inputs are consistent.
What’s inside
- Inputs — 5 periods × 26 lines with a balance-sheet check row
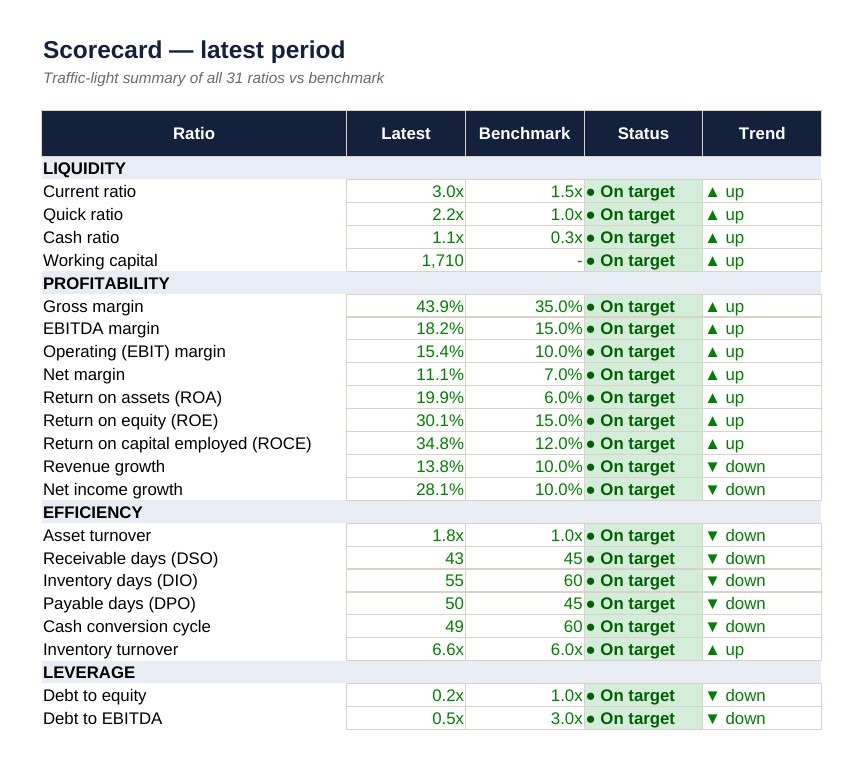
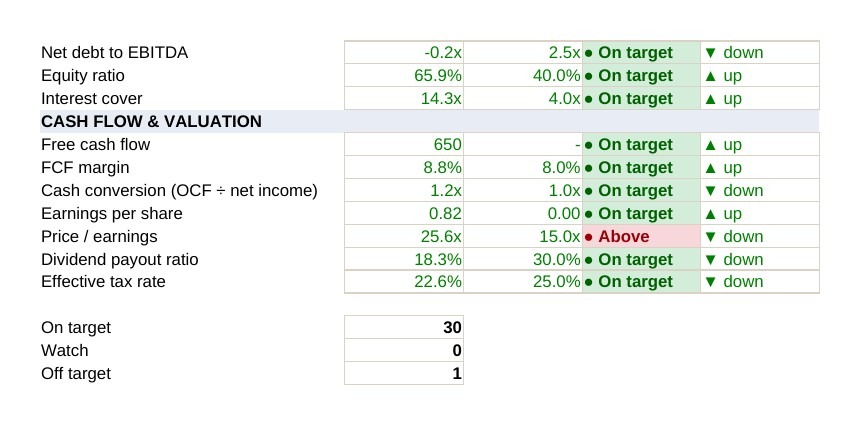
- Ratios — current, quick, cash ratio, working capital; gross/EBITDA/EBIT/net margins, ROA, ROE, ROCE, growth; asset turnover, DSO, DIO, DPO, cash conversion cycle, inventory turnover; debt/equity, debt/EBITDA, net debt/EBITDA, equity ratio, interest cover; FCF, FCF margin, cash conversion, EPS, P/E, payout, effective tax rate
- Every ratio shows its formula in words, an editable benchmark and whether higher or lower is better
- Traffic-light status for the latest period and a trend arrow vs the prior period
- DuPont sheet — ROE = net margin × asset turnover × equity multiplier, with reconciliation check and chart
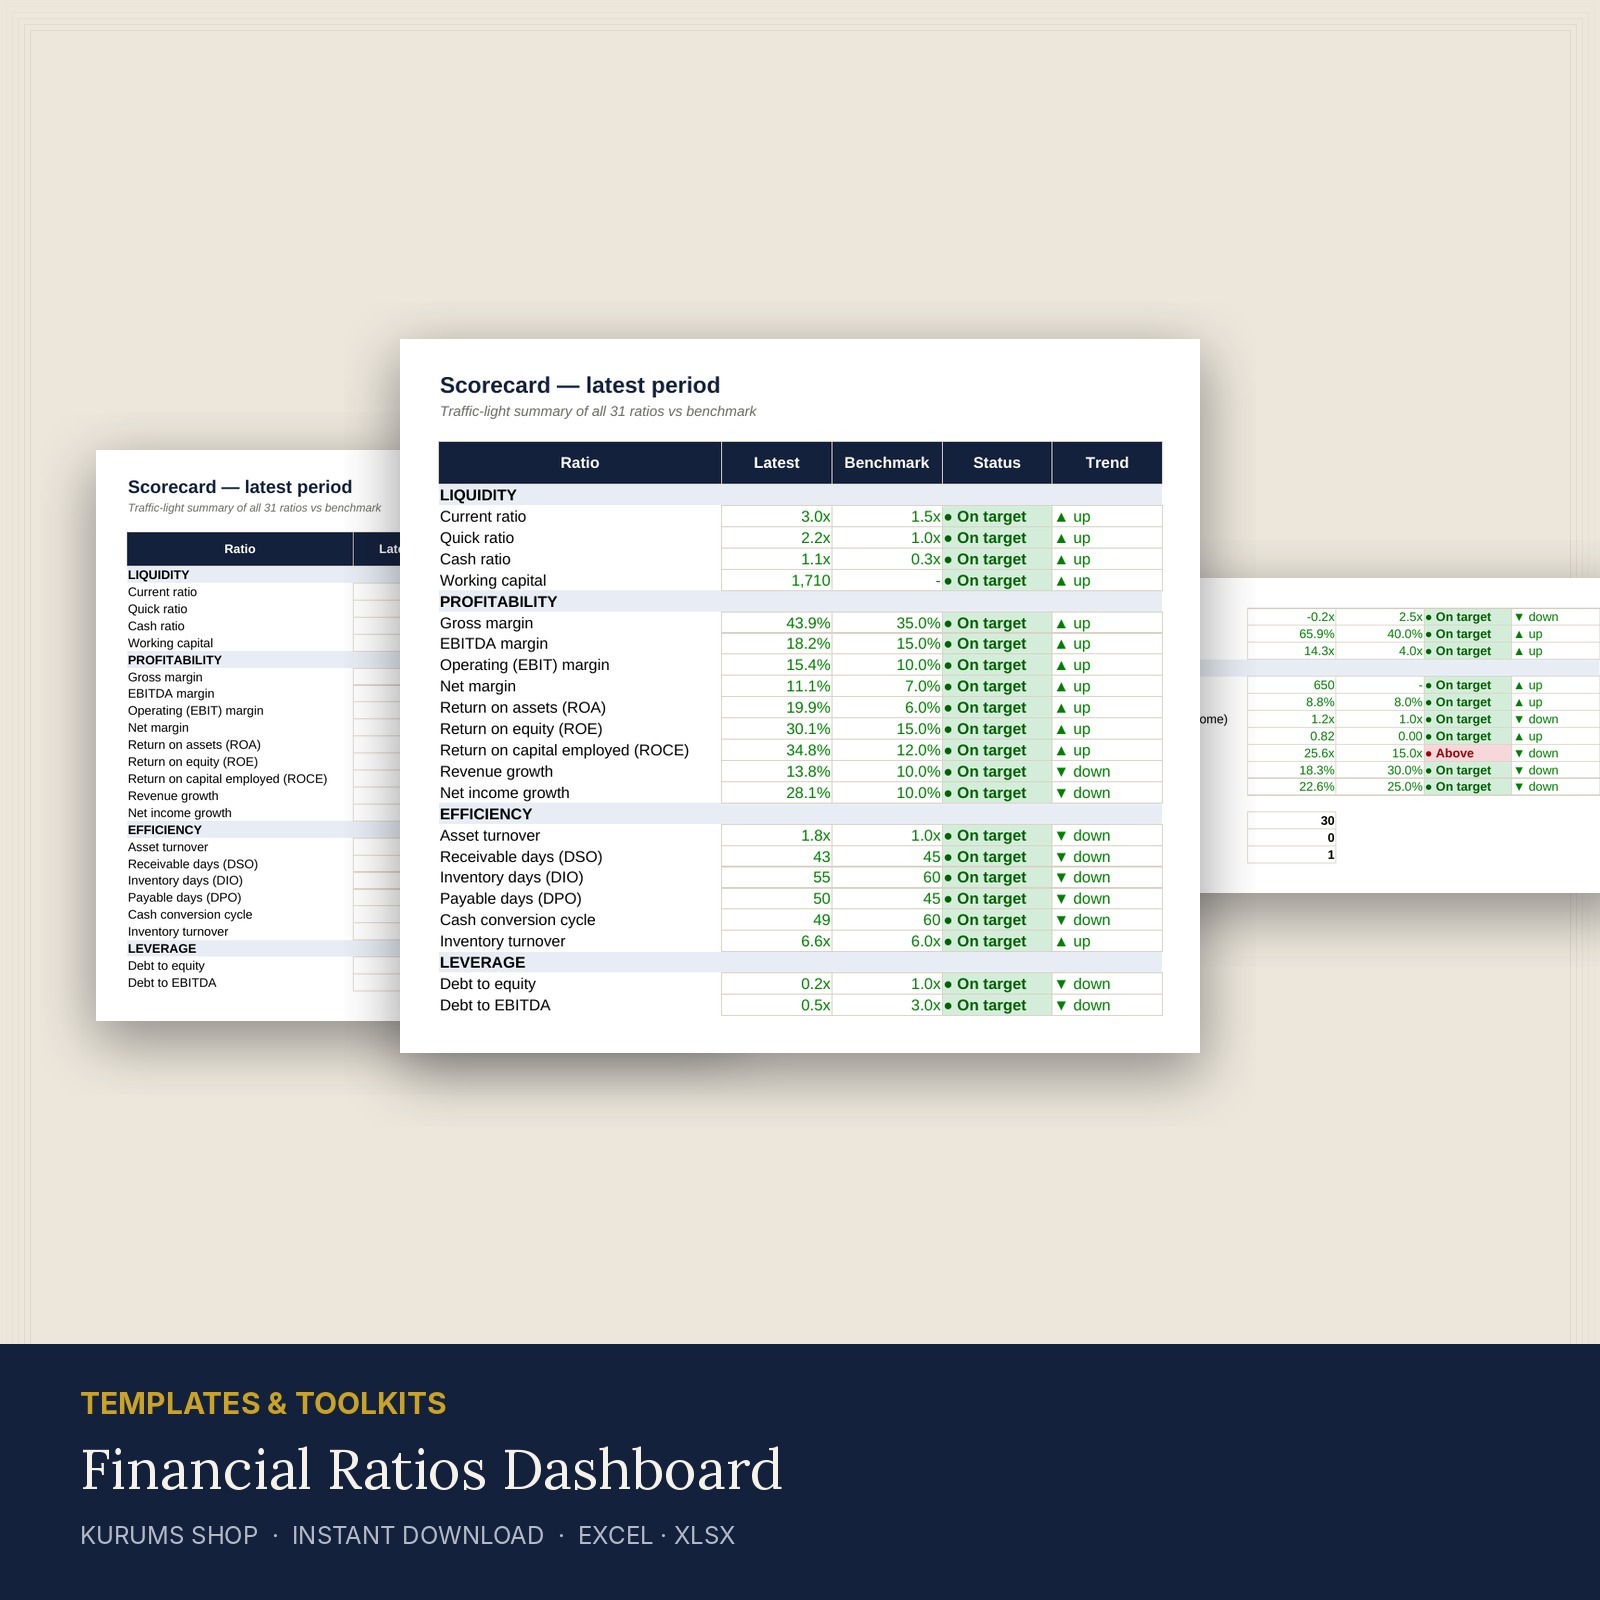
- Scorecard — one-page summary with on-target / watch / off-target counts
Sizes & formats
- Excel .xlsx (Excel 2010+, Google Sheets, LibreOffice, Numbers)
- No macros; sample figures included
Formats: XLSX. Print at home, at the office or send the PDF straight to a local print shop.
Who it’s for
Analysts, credit teams, CFOs preparing a board or lender pack, students of corporate finance, and founders benchmarking their own numbers.
How it works
- Check out securely (card via iyzico, USD).
- Your download link appears on the order page and in your e-mail immediately.
- Print as many copies as you need for yourself or your team.
FAQ
Where do the benchmarks come from?
They are generic mid-market guide values and are deliberately editable — replace them with your industry norms.
Can I add periods?
Yes — insert columns on the Inputs and Ratios sheets following the existing pattern.
Does it work with quarterly data?
Yes; set ‘Days in period’ to the quarter length so the day-based ratios stay correct.
Digital product — no physical item is shipped. Personal and in-company use; no resale or redistribution. Part of the Quiet Capital collection by Kurums.
Discover more from Kurums | Business Intelligence
Subscribe to get the latest posts sent to your email.
Reviews
There are no reviews yet.