
The Historical Context and Evolution of Corporate Income Statements
To fundamentally understand how to prepare an income statement in the modern corporate era, one must first appreciate the evolutionary trajectory of financial reporting. The genesis of the income statement, traditionally known as the profit and loss (P&L) statement, traces back to the 14th-century Renaissance period in Italy. During this epoch, Luca Pacioli codified the double-entry bookkeeping system, providing merchant traders with a rudimentary but revolutionary method to track revenues against expenditures over specific mercantile voyages. However, these early statements were highly customized, non-standardized, and geared primarily toward internal proprietary use rather than external stakeholder evaluation.
The dawn of the Industrial Revolution catalyzed the need for more sophisticated financial tracking. As corporations shifted from simple trade to complex manufacturing, the necessity to allocate massive capital expenditures, track labor costs, and value standing inventory birthed the foundational concepts of cost accounting. Yet, it was the catastrophic stock market crash of 1929 and the subsequent Great Depression that fundamentally transformed financial reporting. In the United States, the formation of the Securities and Exchange Commission (SEC) and the enactment of the Securities Act of 1933 mandated standardized, audited financial disclosures for publicly traded enterprises. This era gave rise to Generally Accepted Accounting Principles (GAAP), establishing a rigid framework that dictated how corporations must prepare an income statement to ensure transparency, comparability, and integrity in the public capital markets.
As globalization accelerated in the late 20th and early 21st centuries, the demand for cross-border financial comparability led to the widespread adoption of International Financial Reporting Standards (IFRS). Today, the income statement is an incredibly sophisticated document governed by complex regulatory codifications, such as ASC 606 for revenue recognition and ASC 740 for income taxes. Moving forward, the future of the income statement is intrinsically linked to digital transformation. Automation, artificial intelligence, and real-time continuous accounting are replacing the traditional month-end close cycle, allowing corporate finance teams to generate dynamic, predictive profitability models rather than merely historical static reports.
The Strategic Blueprint: Deconstructing the Multi-Step Income Statement
When corporate finance teams set out to prepare an income statement, they must choose between a single-step and a multi-step format. For corporate entities, the multi-step format is universally mandated due to its unparalleled ability to segregate operating activities from non-operating activities. This separation is paramount for investors, equity analysts, and internal management, as it isolates the recurring profitability of the core business from incidental financial events.
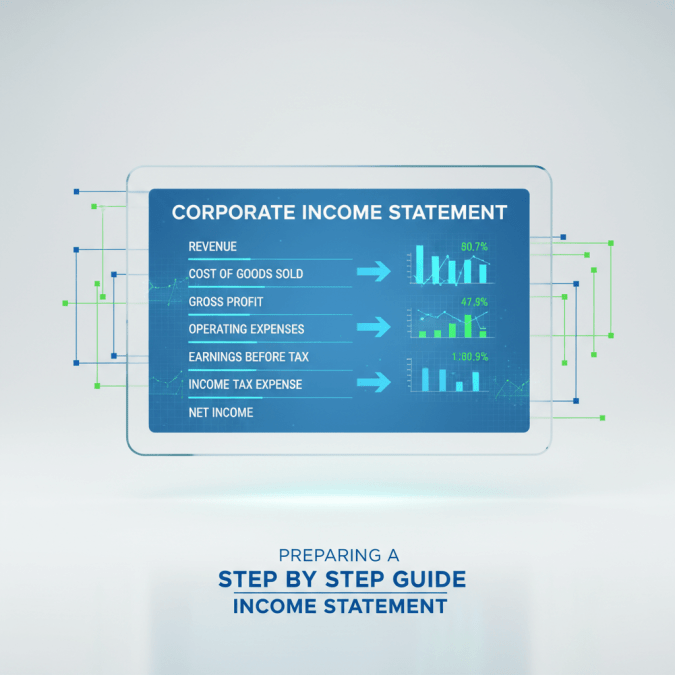
A masterfully constructed multi-step income statement follows a rigid cascading structure:
- Gross Margin Generation: Net Revenue minus Cost of Goods Sold (COGS) equals Gross Profit. This measures the pure production efficiency of the enterprise.
- Operating Margin Generation: Gross Profit minus Operating Expenses (SG&A, R&D, D&A) equals Operating Income (EBIT). This reflects the profitability of standard business operations.
- Net Margin Generation: Operating Income plus/minus Non-Operating Items (Interest, FX gains/losses) and Taxes equals Net Income. This is the ultimate bottom line attributable to shareholders.
Understanding this architecture is the first mandatory phase when you prepare an income statement. Each tier of the statement answers a specific strategic question: Is the product inherently profitable? Is the corporate overhead sustainable? Is the capital structure and tax strategy optimized?
Step 1: Advanced Revenue Recognition and Tracking
The top line of the income statement dictates the narrative for the entire document. However, recognizing corporate revenue is no longer a simple matter of recording cash receipts. The convergence of GAAP and IFRS brought forth the ASC 606 / IFRS 15 standard: Revenue from Contracts with Customers. This standard dictates a robust five-step framework that finance teams must meticulously navigate to prepare an income statement that withstands audit scrutiny.
The ASC 606 Five-Step Framework
To accurately track and report revenue, financial controllers must execute the following protocol:
- Identify the Contract with the Customer: The agreement must have commercial substance, clear payment terms, and mutually approved rights regarding the transfer of goods or services.
- Identify the Performance Obligations: Complex corporate contracts often bundle goods and services. For example, a software enterprise might sell a perpetual license, a mandatory implementation service, and ongoing post-contract customer support (PCS). Each of these represents a distinct performance obligation.
- Determine the Transaction Price: This requires calculating the gross consideration expected, adjusted for variable considerations such as volume discounts, rebates, rights of return, and performance bonuses.
- Allocate the Transaction Price: The total transaction price must be allocated to the distinct performance obligations based on their standalone selling prices (SSP).
- Recognize Revenue as Obligations are Satisfied: Revenue is recognized either at a point in time (e.g., the delivery of a physical hardware unit) or over time (e.g., the ratable recognition of a 12-month SaaS subscription).
Failure-Case Analysis: The Channel Stuffing Pitfall
A classic failure in revenue recognition occurs through a practice known as “channel stuffing.” In this scenario, an aggressive management team, desperate to meet quarterly earnings targets, incentivizes distributors to purchase excess inventory at quarter-end through massive, abnormal discounts or extended payment terms, often paired with side agreements allowing unconditional returns. While this artificially inflates gross revenue for the current period, it violates the principle of variable consideration and the true transfer of risk under ASC 606. When the subsequent quarter arrives, distributors return the unsold inventory, triggering catastrophic revenue reversals, collapsing the gross margin, and inviting regulatory investigations. When you prepare an income statement, robust controls must be in place to differentiate legitimate end-user demand from artificial channel stuffing.
Step 2: Calculating the Cost of Goods Sold (COGS)
Directly beneath revenue lies the Cost of Goods Sold (COGS) or Cost of Sales. This represents the direct, attributable costs incurred in the production of the goods or services sold by the enterprise. Precision in calculating COGS is vital, as it directly impacts Gross Profit, a key metric heavily scrutinized by equity analysts assessing pricing power and production efficiency.
Inventory Valuation Methodologies
For product-centric corporations, COGS is inextricably linked to inventory accounting. The mathematical formula for COGS is straightforward: Beginning Inventory + Net Purchases – Ending Inventory = COGS. However, the valuation of that ending inventory fundamentally alters the reported COGS. Financial standards allow for several inventory costing assumptions:
- First-In, First-Out (FIFO): Assumes the oldest inventory items are sold first. In an inflationary environment, FIFO matches older, lower-cost inventory against current revenues, resulting in lower COGS, higher Gross Profit, and higher taxable income.
- Last-In, First-Out (LIFO): Assumes the newest inventory items are sold first. During inflation, LIFO matches recent, higher-cost inventory against revenues, resulting in higher COGS, lower Gross Profit, and reduced tax liabilities. (Note: LIFO is permitted under US GAAP but strictly prohibited under IFRS).
- Weighted Average Cost: Blends the cost of all available units in inventory, smoothing out price fluctuations.
The choice of valuation has profound implications on the income statement, especially during periods of macroeconomic volatility and supply chain inflation.
| Metric in Inflationary Period | FIFO Method | LIFO Method | Weighted Average Method |
|---|---|---|---|
| Reported COGS | Lowest | Highest | Moderate |
| Reported Gross Profit | Highest | Lowest | Moderate |
| Income Tax Burden | Highest | Lowest | Moderate |
| Balance Sheet Inventory Value | Closest to current market value | Significantly understated | Blended historical value |
Direct vs. Indirect Cost Allocation
To accurately prepare an income statement, management accountants must rigorously separate direct costs from indirect expenses. COGS must only include direct materials, direct labor, and manufacturing overhead (applied via predetermined overhead rates based on machine hours or direct labor hours). Allocating corporate administrative expenses to COGS is a severe accounting violation. Conversely, failing to capitalize factory depreciation or factory supervisor salaries into inventory (thereby pushing them to COGS when sold) misrepresents Gross Margin. For Software-as-a-Service (SaaS) entities, COGS (often termed Cost of Revenue) includes cloud hosting fees (AWS, Azure), customer success personnel directly involved in technical delivery, and amortization of capitalized software development costs.
Step 3: Structuring Operating Expense Deductions
Below the Gross Profit line lie the Operating Expenses (OpEx). These represent the day-to-day costs of running the corporate machinery that are not directly tied to the production of individual goods. Accurate structuring of these deductions is essential to present a true representation of Operating Income (EBIT), which is widely considered the truest measure of management’s operational competency.
Selling, General, and Administrative Expenses (SG&A)
SG&A forms the bulk of corporate operating expenses. This category must be broken down systematically:
- Selling Expenses: Commissions, advertising, marketing campaigns, travel and entertainment for sales staff, and outbound freight.
- General and Administrative (G&A): Executive compensation, human resources, IT infrastructure, legal fees, audit fees, and corporate headquarters rent.
Analyzing SG&A as a percentage of revenue is a critical efficiency metric. When corporations scale, stakeholders look for SG&A leverage—the phenomenon where revenue grows exponentially faster than the fixed components of G&A, leading to margin expansion.
Depreciation and Amortization (D&A)
D&A represents the systematic allocation of the cost of tangible and intangible long-lived assets over their useful lives. The methodology chosen—whether straight-line, declining balance, or units-of-production—profoundly affects reported operating expenses.
For high-capex industries (e.g., telecommunications, manufacturing), depreciation is a massive non-cash expense that suppresses Net Income but does not impact operational cash flow. This is why financial analysts heavily rely on EBITDA (Earnings Before Interest, Taxes, Depreciation, and Amortization) to evaluate cash-generating capability. When preparing the income statement, ensure that D&A related to the corporate office is reported in OpEx, while D&A related to the manufacturing plant is properly absorbed into inventory and subsequently COGS.
Research and Development (R&D)
R&D expenses are critical for the future viability of technology, pharmaceutical, and automotive companies. Under US GAAP, the conservative approach is mandated: almost all R&D must be expensed immediately on the income statement as incurred, due to the high uncertainty of future economic benefits. This suppresses current period profitability but prevents the balance sheet from inflating with highly speculative assets. However, under IFRS (IAS 38), once a project reaches a state of “technical feasibility,” subsequent development costs must be capitalized and amortized. This divergence means a multinational corporation must maintain separate ledgers to properly prepare an income statement for both GAAP and IFRS jurisdictions.
Step 4: Non-Operating Items and Tax Provisioning
The transition from Operating Income to Net Income involves traversing “below the line” items. These encompass financial activities distinct from the company’s core commercial operations.
Interest Expense and Other Income
Corporate capital structures vary wildly. A leveraged buyout (LBO) entity will carry immense debt loads, resulting in staggering interest expenses that can easily wipe out healthy operating margins. By keeping interest expense isolated in the non-operating section, external analysts can strip away the effects of capital structure to assess the underlying business. This section also captures realized and unrealized foreign currency exchange (FX) gains and losses, dividend income from minority investments, and one-time restructuring charges or legal settlements.
Income Tax Provisioning (ASC 740)
Perhaps the most technically demanding aspect when you prepare an income statement is calculating the income tax expense. This is not simply multiplying pre-tax income by the statutory corporate tax rate. Accounting rules (ASC 740 / IAS 12) require the calculation of both current tax expense (what is actually owed to the IRS or regional tax authority this year) and deferred tax expense.
Because tax accounting rules (e.g., MACRS accelerated depreciation) differ from book accounting rules (e.g., straight-line depreciation), temporary timing differences arise. These differences generate Deferred Tax Liabilities (DTLs) and Deferred Tax Assets (DTAs). The income tax provision line item on the income statement is a complex amalgamation of the current period tax bill plus the net change in these deferred accounts. Failure to properly reconcile the effective tax rate against the statutory rate via a deferred tax valuation allowance analysis is a frequent trigger for audit deficiencies.
Step 5: Assembly, Validation, and Financial Analysis
With all components calculated, the final step to prepare an income statement is meticulous assembly, formatting, and analytical validation. This ensures the numbers do not merely balance, but that they tell a coherent, economically sound story about the enterprise.
The Income Statement Preparation Checklist
To establish a flawless financial reporting process, corporate controllers should enforce the following rigorous review protocols during the month-end or quarter-end close cycle:
- Trial Balance Reconciliation: Ensure all revenue and expense accounts from the general ledger perfectly tie to the adjusted trial balance before drafting the statement.
- Cut-Off Testing: Verify that revenues and expenses at the end of the period are recorded in the correct accounting period, ensuring absolute alignment with the matching principle.
- Accrual and Prepayment Review: Confirm that all manual journal entries for accrued liabilities (e.g., accrued payroll, accrued bonuses) and prepaid expenses (e.g., prepaid insurance, annual software licenses) have been properly calculated and posted.
- Variance Analysis (Actuals vs. Budget): Conduct a rigorous line-by-line review comparing current period actuals to the forecasted budget and to the same period in the prior year (YoY). Any variance exceeding a materiality threshold (e.g., +/- 5% or $50,000) requires documented narrative explanation from department heads.
- Intercompany Eliminations: For consolidated corporate entities, guarantee that all intercompany revenues, management fees, and cost-sharing allocations are 100% eliminated. Failing to eliminate intercompany transactions will artificially bloat both the top line and operating expenses.
Deriving Key Performance Indicators (KPIs)
The ultimate goal of preparing this document is to fuel corporate decision-making. Analysts will extract key ratios from the finalized document:
- Gross Margin Percentage: (Gross Profit / Revenue) x 100. Indicates production efficiency and pricing power.
- Operating Margin Percentage: (Operating Income / Revenue) x 100. Evaluates management’s ability to control overhead and administrative costs relative to sales.
- Net Profit Margin: (Net Income / Revenue) x 100. Shows the final percentage of revenue that translates into shareholder equity.
- Earnings Per Share (EPS): For public companies, Net Income minus Preferred Dividends, divided by the weighted average number of outstanding common shares. EPS is the ultimate benchmark against which Wall Street measures corporate success.
Future Trends in Income Statement Preparation
The methodology required to prepare an income statement is on the precipice of a massive technological revolution. The traditional paradigm relies heavily on manual interventions, static spreadsheet manipulation, and retrospective analysis occurring 10 to 15 days after the month concludes. Future corporate reporting will look drastically different.
Artificial Intelligence and the Continuous Close
Robotic Process Automation (RPA) and Artificial Intelligence (AI) are rapidly dismantling the traditional accounting cycle. Machine learning algorithms can now perform automated, real-time transaction categorization, instantly matching supplier invoices to purchase orders and dynamically posting accruals. This technological leap enables the concept of the “continuous close,” where the general ledger is perpetually balanced, and corporate leadership can generate an accurate income statement at any given second of the month. Predictive AI models will also begin supplementing historical data, automatically generating probabilistic forecasts alongside actualized P&L results.
Extensible Business Reporting Language (XBRL)
Regulatory bodies globally are demanding digital-first reporting. XBRL mandates require corporate finance teams to assign machine-readable meta-tags to every single line item on the income statement. This allows automated compliance checking by the SEC and instant algorithmic parsing by hedge funds and financial data aggregators. Preparing the income statement now requires software solutions capable of mapping internal ledger codes to complex external taxonomy tags without error.
Integration of ESG Metrics
Historically, the income statement only dealt with financial capital. Moving forward, the integration of Environmental, Social, and Governance (ESG) metrics into financial disclosures is becoming a reality. Future iterations of the income statement may require dual-reporting frameworks where traditional financial COGS and OpEx are juxtaposed against “carbon costs” or environmental impact expenditures. Stakeholders are increasingly demanding to see the intersection of corporate profitability and sustainability, forcing controllers to capture a broader array of non-financial data streams.
Conclusion
To successfully prepare an income statement is to execute one of the most critical responsibilities in corporate finance. It demands a sophisticated understanding of regulatory frameworks like ASC 606 and ASC 740, a highly disciplined approach to inventory and expense categorization, and an unyielding commitment to audit-ready controls. From calculating accurate gross margins to navigating the intricate web of deferred taxation, the multi-step income statement serves as the definitive scorecard of corporate health. As automation and AI redefine the speed and accuracy of accounting functions, finance professionals who master both the rigid technical fundamentals and the strategic analytics embedded in the income statement will be uniquely positioned to drive enterprise value in an increasingly complex global economy.
Discover more from Kurums | Business Intelligence
Subscribe to get the latest posts sent to your email.