
 Play
PlayGames / Finance
Trend Spotter
Ten business charts, one question each. Tap the bar that answers it: the best month, the fastest growth, the biggest miss against budget or the month the bank balance goes negative. Every chart is generated fresh, so no two games are the same. You have five hearts.
How to play Trend Spotter
Four questions every finance chart answers
- Where is the peak? The tallest bar is the easy one, but check the scale first. A chart that does not start at zero makes small differences look large.
- What grew fastest? Absolute growth and percentage growth are different questions. Going from 20 to 36 is an 80% rise; going from 75 to 101 adds more but is only about 35%. Small bases flatter percentages.
- Where did we miss plan? In a budget chart the gap between the bar and the budget line is the variance. Finance teams explain the biggest variances first, whatever their direction.
- When does cash run out? A monthly cash flow chart only tells you about runway once you add each month to the opening balance. The first month the running total goes negative is the cash cliff.
Why chart reading matters
Finance guides
Nobel Economics Prize to Hall and Woodford, October 12, 2026: Notes for Finance
On October 12, 2026, Robert Hall and Michael Woodford won the Nobel economics prize for the microeconomic foundations of macroeconomic stabilization used by central banks worldwide.
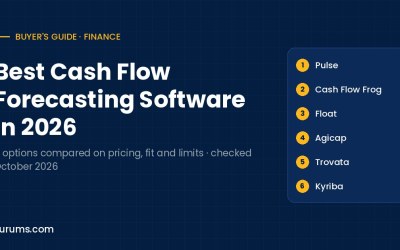
Best Cash Flow Forecasting Software in 2026: SMB to Treasury Compared
Six cash flow forecasting tools compared on published pricing, forecast horizon, data connections and scenario planning, from $29 a month to enterprise treasury.
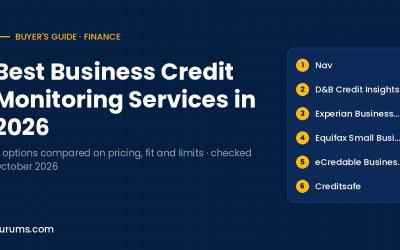
Best Business Credit Monitoring Services in 2026: Bureau Plans Compared
Six ways to monitor your own company’s business credit compared on price, bureaus covered, alerts, credit-building features and limits, from free plans to annual subscriptions.