- What is process costing? It is an accounting methodology used in mass production to assign costs to masses of similar units by averaging total production costs over specific periods.
- Why is it crucial for 2026 manufacturing? In an era of hyper-automation and high-volume output, manual unit tracking is impossible. Process costing identifies invisible cost leakages and protects shrinking margins.
- What are equivalent units? They are a derived measure of output that translates partially completed units into fully completed units for cost allocation purposes.
- How does it differ from job costing? While job costing tracks unique, custom orders, process costing focuses on continuous flows of identical products like chemicals, food, or textiles.
In the high-stakes world of large-scale manufacturing, precision is not just a goal—it is a survival mechanism. As we move through 2026, the complexity of global supply chains and the razor-thin nature of manufacturing margins have made traditional accounting methods obsolete for mass producers. If your facility produces thousands of identical items daily, tracking the specific cost of a single unit as it moves through the line is not just difficult; it is mathematically impossible. This is where Process Costing steps in as the ultimate financial architect of the factory floor.
Process costing functions by accumulating costs within specific departments or production phases rather than individual items. This methodology is the backbone of industries ranging from petrochemicals to semiconductor fabrication. But here is the kicker: many organizations fail to implement it correctly, leading to “invisible” cost leakages that erode profitability from the inside out. In this comprehensive guide, we will deconstruct the mechanics of process costing and provide a blueprint for high-volume implementation.
1. The Fundamental Architecture of Process Costing
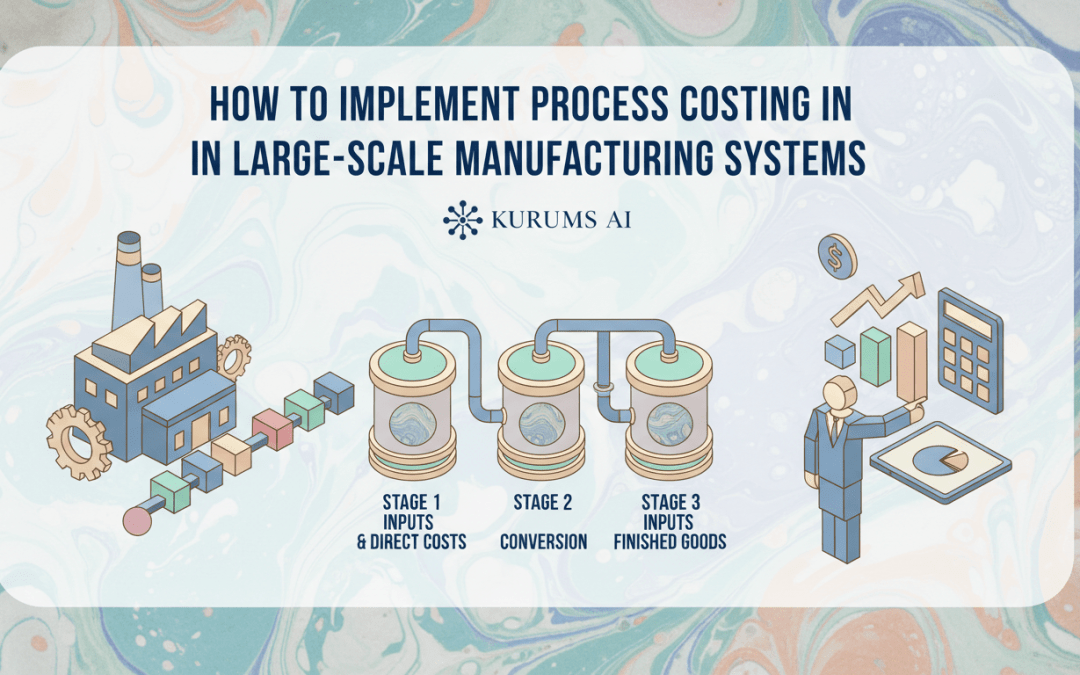
To understand process costing, one must first visualize the manufacturing plant not as a collection of machines, but as a series of interconnected “cost centers.” In a large-scale system, raw materials enter the first department, undergo transformation, and are then “transferred out” to the next department. Each stage adds value—and cost.
Unlike job-order costing, which treats every product as a unique project, process costing assumes homogeneity. Whether you are bottling 10,000 liters of beverage or weaving 5,000 meters of industrial fabric, the cost of the first unit should theoretically be identical to the last. The goal is to determine the average cost per unit for a given period (a month, a week, or even a shift).
But why does this matter so much today? Let’s look at the numbers. In a facility operating at 95% efficiency, a 1% error in cost allocation can result in millions of dollars in unaccounted-est expenses by the end of the fiscal year. Process costing provides the granular visibility needed to catch these discrepancies before they hit the bottom line.
The Three Pillars of Process Costs
Every process costing system relies on three primary inputs. Understanding how these interact within your specific production flow is the first step toward implementation:
- Direct Materials: These are the physical components added at various stages. Note that materials aren’t always added at the start; some are introduced at the 50% or 90% completion mark.
- Direct Labor: The human effort involved in overseeing the machinery and processes. In 2026, this increasingly includes the cost of specialized technicians monitoring automated systems.
- Manufacturing Overhead: The “indirect” costs—utilities, factory rent, machine depreciation, and maintenance. In high-volume systems, overhead often constitutes the largest portion of the total unit cost.
2. Comparing Process Costing vs. Job-Order Costing
Before diving deeper into the technicalities, it is essential to determine if process costing is truly the right fit for your operation. Many manufacturers attempt to use a hybrid approach, but for mass production, a pure process costing system is usually superior. But how do they actually compare?
The primary difference lies in the cost object. In job-order costing, the cost object is the “job” or “order.” In process costing, the cost object is the “process” or the “department.” This shift in focus allows for massive scalability. Imagine trying to track the electricity used by a single soda bottle—it’s absurd. Instead, you track the electricity used by the Bottling Department for the month and divide it by the number of bottles produced.
| Feature | Process Costing | Job-Order Costing |
|---|---|---|
| Product Type | Homogeneous, mass-produced items. | Unique, custom-built products. |
| Cost Accumulation | By department or time period. | By specific job or batch. |
| Unit Cost Calculation | Total costs / Equivalent units. | Total job cost / Units in job. |
| Record Keeping | Simplified, focused on flow. | Complex, detailed for each order. |
| Common Industries | Oil, Chemicals, Food, Textiles. | Construction, Legal, Custom Cabinetry. |
You see, the choice isn’t just about accounting preference; it’s about the physical reality of your production line. If you can’t tell unit #405 apart from unit #4,005, you are in the realm of process costing.
3. Mastering Equivalent Units: The Heart of the System
Now, let’s get technical. One of the biggest challenges in manufacturing accounting is dealing with Work-in-Process (WIP). At the end of an accounting period, you will inevitably have products that are partially finished. They aren’t raw materials anymore, but they aren’t finished goods either.
How do you assign costs to these “half-baked” items? The answer is Equivalent Units (EU). Equivalent units translate partially completed units into an equivalent number of fully completed units. For example, if you have 1,000 units that are 60% complete in terms of conversion costs, you have 600 equivalent units.
But wait, it gets more complex. Materials and conversion costs often have different completion percentages. In a paint manufacturing plant, 100% of the pigments (materials) might be added at the start, but the mixing and refinement (conversion) might only be 40% complete by the end of the month. You must calculate EUs separately for materials and conversion to avoid massive valuation errors.
The Five-Step Process for Cost Allocation
To implement this successfully, your accounting team must follow these five rigorous steps every period:
- Analyze Physical Flow: Track the total number of units that entered and left the department.
- Calculate Equivalent Units: Determine the EU for both materials and conversion costs for the ending WIP.
- Determine Total Costs: Summarize all costs (beginning WIP + costs added during the period).
- Compute Cost per EU: Divide total costs by the total equivalent units.
- Assign Costs: Allocate the calculated costs to completed units (transferred out) and units remaining in WIP.
4. FIFO vs. Weighted-Average: Choosing Your Strategy
When implementing process costing, you must choose a cost flow assumption. This decision has significant implications for your tax liability and financial reporting. There are two primary contenders: Weighted-Average and FIFO (First-In, First-Out).
The Weighted-Average method is the simpler of the two. It blends the costs of the beginning WIP with the costs added during the current period. This creates a “smoothed” average cost. It is excellent for industries where prices of raw materials are relatively stable. However, it can hide fluctuations in production efficiency because it mixes old and new costs.
The FIFO method, on the other hand, keeps the costs of the beginning WIP separate from the costs added during the current period. It assumes that the first units started are the first units finished. This is much more accurate for tracking performance and managing costs in volatile markets (like the 2026 energy market). It provides a clearer picture of what it costs to produce a unit right now.
But why is this distinction so critical for large-scale systems? In a FIFO system, if your energy costs spike in the second week of the month, you will see that reflected immediately in the cost of the units produced during that period. In a weighted-average system, that spike is diluted, potentially leading to delayed management reactions.
5. Dealing with Spoilage, Waste, and Scrap
In any mass production environment, perfection is a myth. Machines fail, raw materials are contaminated, and human error occurs. In process costing, we categorize these losses into two types: Normal Spoilage and Abnormal Spoilage.
Normal spoilage is inherent to the process. If you are cutting steel plates, you will always have “off-cuts.” These costs are treated as part of the product cost and are absorbed by the “good” units produced. Essentially, the cost of the waste is built into the price of the product.
Abnormal spoilage is different. This is waste that should not have happened—a machine fire, a major power surge, or a shipment of defective raw materials. These costs are not assigned to the products. Instead, they are charged to a “Loss from Abnormal Spoilage” account and reported separately on the income statement. This ensures that your unit cost data remains “clean” and reflects normal operating conditions.
Tracking the Cost of Quality
Modern manufacturers in 2026 use IoT sensors to track spoilage in real-time. By integrating this data into the process costing model, managers can pinpoint exactly which stage of the process is producing the most waste. Is it the heating phase? The cooling phase? The data doesn’t lie.
6. Advanced Overhead Allocation in a Smart Factory
We’ve discussed materials and labor, but what about the “invisible” costs? In a large-scale manufacturing system, Manufacturing Overhead (MOH) is often the most difficult element to allocate. Traditionally, factories used “Direct Labor Hours” as a base for overhead. However, in a factory full of robots, direct labor hours are nearly zero.
To implement process costing effectively today, you must use Activity-Based Costing (ABC) principles within your process costing framework. Instead of one giant overhead pool, you create multiple pools based on activities like:
- Machine Setup: Cost allocated based on the number of production runs.
- Quality Inspection: Cost allocated based on the number of units inspected or hours spent testing.
- Facility Maintenance: Cost allocated based on machine hours (the more a machine runs, the more overhead it absorbs).
- Digital Infrastructure: The cost of the AI and cloud systems managing the floor, allocated based on data throughput.
| Overhead Category | Allocation Base (2026 Standard) | Impact on Unit Cost |
|---|---|---|
| Energy/Utilities | Kilowatt-hours per Process Phase | High (Variable) |
| Robotic Maintenance | Machine Run-Time Hours | Medium (Fixed) |
| Material Handling | Number of Pallet Movements (AGVs) | Low (Step-Variable) |
| AI Management Systems | System API Calls / Data Logic Volume | New Variable (Scaling) |
7. Step-by-Step Implementation Roadmap
Ready to overhaul your costing system? Implementation is not an overnight task; it requires alignment between accounting, engineering, and IT. Here is the roadmap for a successful rollout:
Phase 1: Process Mapping
Identify the logical breakpoints in your production line. Each “department” in your process costing system should represent a significant change in the product’s state. For a beverage company, this might be: 1. Mixing, 2. Carbonation, 3. Bottling, 4. Packaging. Each of these will be its own “Work-in-Process” account.
Phase 2: Data Synchronization
Ensure your ERP (Enterprise Resource Planning) system is receiving real-time data from the shop floor. If your accounting software thinks you produced 5,000 units but the machines actually produced 4,800 due to waste, your unit cost will be wrong from day one.
Phase 3: Setting Standard Costs
While process costing tracks actual costs, you need “Standard Costs” as a benchmark. Standard costing within a process costing system allows you to perform Variance Analysis. When actual costs deviate from the standard, the system should trigger an immediate alert.
8. Transferred-In Costs: The Relay Race of Manufacturing
Think of process costing like a relay race. Department A finishes its work and passes the “baton” (the product) to Department B. But the baton isn’t just the physical product—it’s also the accumulated costs from Department A.
These are called Transferred-In Costs. They are treated as a separate category of materials added at the beginning of the process in the subsequent department. A common mistake is failing to track these separately, which makes it impossible to see where inefficiencies are originating. If Department D has a high unit cost, is it because Department D is inefficient, or because Department C passed down high-cost materials?
By isolating transferred-in costs, you can hold department managers accountable for only the costs they directly control. This is the essence of Responsibility Accounting.
9. The Role of AI and Automation in 2026 Process Costing
The manufacturing landscape has changed. We are no longer relying on end-of-month spreadsheets. Implementation of process costing today involves “Continuous Costing.”
Artificial Intelligence now allows for Predictive Process Costing. By analyzing historical data, AI can predict the equivalent units of WIP at any given moment with 99% accuracy. It can also identify patterns in overhead consumption that human accountants might miss. For example, an AI might notice that machine wear-and-tear (and thus maintenance overhead) increases exponentially when production speed is pushed past 110% of the rated capacity.
- Real-time WIP Valuation: No more waiting for the “month-end close” to know your inventory value.
- Automated Spoilage Detection: Computer vision identifies defective units and automatically removes them from the “good unit” count in the costing system.
- Energy-Aware Costing: Direct integration with smart grids to allocate higher overhead costs to units produced during “peak” energy pricing hours.
10. Common Pitfalls and How to Avoid Them
Even with the best technology, human and systemic errors can compromise your process costing implementation. Let’s look at the most frequent traps:
Pitfall 1: Over-complicating Departments. If you create a “department” for every single machine, the administrative burden of tracking transfers will outweigh the benefits of the data. Keep departments broad enough to be manageable but narrow enough to be distinct.
Pitfall 2: Misestimating Completion Percentages. This is the “EU Trap.” Accountants often guess that WIP is “about 50% complete.” If it’s actually 70%, your unit costs will be overstated. Work with floor engineers to establish objective physical milestones for completion percentages.
11. Protecting Your Manufacturing Margins
Ultimately, why do we go through all this trouble? The goal is Margin Protection. In a mass production environment, you are often a “price taker,” meaning the market dictates the price of your product. If you cannot control your costs, you cannot control your profit.
Process costing allows for “Target Costing.” If the market price for your product is $10.00 and you want a 20% margin, your total process cost cannot exceed $8.00. By breaking down the $8.00 across five departments, you give every manager a specific target. This granular control is what separates the industry leaders from the laggards in the competitive landscape of 2026.
Conclusion: Moving Toward Costing Excellence
Implementing process costing in a large-scale manufacturing system is not merely a financial exercise—it is a strategic imperative. By mastering equivalent units, choosing the right cost flow assumption, and leveraging 2026’s technological advancements, you can transform your accounting department from a “record keeper” into a “value creator.”
The journey to precise costing requires a commitment to data integrity and a deep understanding of the factory floor. But the rewards—accurate valuations, protected margins, and a clear view of operational efficiency—are worth every ounce of effort. It is time to stop guessing and start calculating. Your margins depend on it.
Ready to revolutionize your manufacturing costs? Start by auditing your current WIP tracking and identifying your three largest “invisible” overhead pools today. The future of manufacturing is data-driven, and process costing is the engine that will get you there.
Discover more from Kurums | Business Intelligence
Subscribe to get the latest posts sent to your email.