Last Updated: May 9, 2026
A company’s financial health is not determined by a single metric but through a holistic analysis of its core reporting structures. For C-level executives and international investors targeting global markets, understanding these documents is the first step in risk mitigation and capital allocation. But here is the real issue: many organizations focus solely on net profit while ignoring the underlying cash movements that dictate long-term solvency. Have you ever wondered why a company reporting record-breaking profits can suddenly declare bankruptcy? The answer lies within the intricate dance between the three pillars of financial reporting.
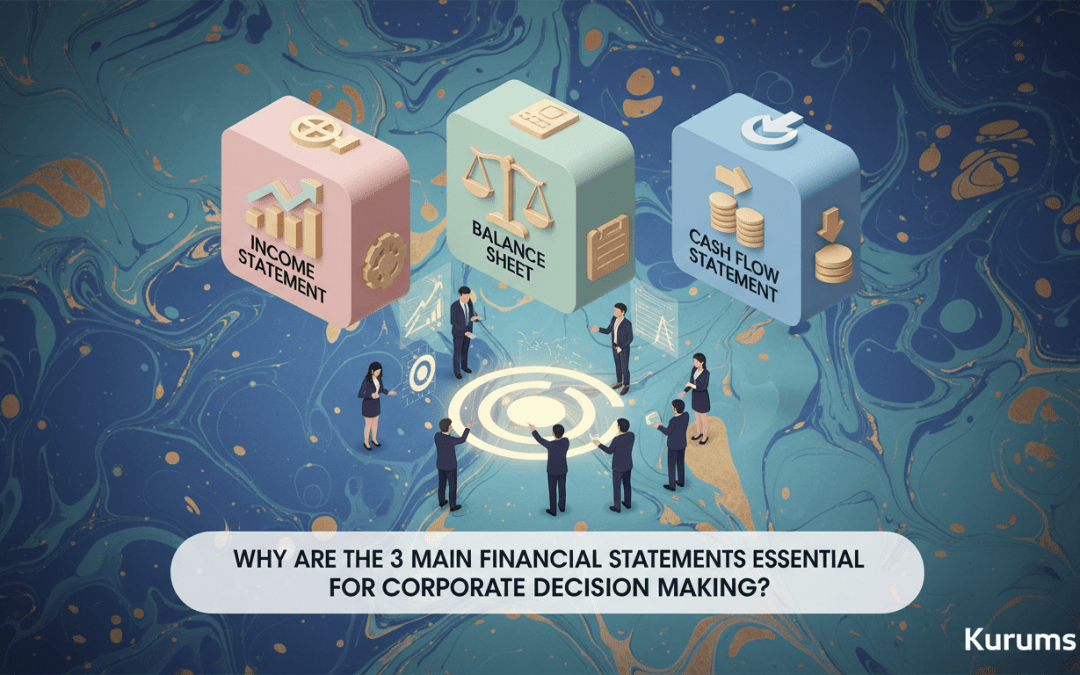
In this comprehensive guide, we will dissect the mechanical inner workings of the Income Statement, Balance Sheet, and Cash Flow Statement. We will explore how they interconnect, why their synergy is vital for strategic growth, and how seasoned CFOs use them to steer billion-dollar enterprises through economic volatility.
1. The Income Statement: The Engine of Operational Profitability
The Income Statement, often referred to as the Profit and Loss (P&L) statement, acts as the company’s “performance report card” over a specific period. It tracks revenue from the top line down to the net income at the bottom line. It answers the fundamental question: Is the business model actually generating wealth after all expenses are paid?
However, looking at the bottom line alone is a dangerous game. To truly understand operational efficiency, one must look at the margins. Gross margin reveals the efficiency of production, while operating margin (EBIT) sheds light on how well the management controls overhead costs. In a corporate environment, these figures are the primary drivers for stock valuation and internal performance reviews.
Think about it this way: The Income Statement is a movie. It shows the flow of activity, the drama of rising costs, and the climax of profit or loss over a quarter or a year. But a movie doesn’t tell you the total value of the studio’s assets—that’s where the next statement comes in.
2. The Balance Sheet: A Snapshot of Financial Stability
If the Income Statement is a movie, the Balance Sheet is a high-resolution photograph. It captures the company’s financial position at a single point in time. It follows the fundamental accounting equation: Assets = Liabilities + Shareholders’ Equity.
This statement provides the structural context for the company’s operations. It tells us what the company owns (Assets), what it owes (Liabilities), and the residual value belonging to the owners (Equity). For investors, the Balance Sheet is the ultimate tool for assessing risk. A company with massive profits but an over-leveraged balance sheet is a house of cards waiting for an interest rate hike to collapse.
Understanding Asset Liquidity and Debt Maturity
Not all assets are created equal. Current assets, such as cash and accounts receivable, are expected to be converted into cash within a year. Non-current assets, like property, plant, and equipment (PP&E), represent the long-term infrastructure. Similarly, liabilities are categorized by their urgency. Analyzing the ratio between current assets and current liabilities (the Current Ratio) is a standard procedure for evaluating short-term survival prospects.
3. The Cash Flow Statement: The Pulse of Business Survival
Cash is king. This is perhaps the most repetitive cliché in finance, yet it remains the most ignored truth in many boardrooms. The Cash Flow Statement (CFS) bridges the gap between the accrual-based Income Statement and the cash-based reality of the bank account. It tracks the actual inflows and outflows of cash during a period.
Why is this essential? Because under accrual accounting, a company can record revenue the moment a contract is signed, even if the client doesn’t pay for six months. Without a Cash Flow Statement, management might think they are wealthy while they are actually unable to pay their employees’ salaries next week.
The CFS is divided into three critical sections:
- Operating Activities: Cash generated from core business operations. This should ideally be the primary source of cash.
- Investing Activities: Cash spent on or earned from assets (buying machinery, selling a subsidiary, or investing in securities).
- Financing Activities: Cash flow related to debt, equity, and dividends (taking a loan, issuing stock, or paying back investors).
4. Comparing the Pillars: Key Differences and Roles
To master corporate finance, one must understand how these three documents contrast and complement each other. They are not redundant; they are three different perspectives on the same financial reality.
| Feature | Income Statement | Balance Sheet | Cash Flow Statement |
|---|---|---|---|
| Primary Purpose | Measures profitability and operational performance. | Measures financial position and net worth. | Measures liquidity and cash movements. |
| Time Frame | A period of time (Quarter/Year). | A specific point in time (Snap-shot). | A period of time (Quarter/Year). |
| Accounting Basis | Accrual Basis. | Accrual Basis. | Cash Basis. |
| Key Metrics | Revenue, EBITDA, Net Income. | Total Assets, Debt-to-Equity, Liquidity. | Free Cash Flow, Burn Rate, OCF. |
5. The Synergy: How the Statements Interconnect
The beauty of modern accounting lies in its mathematical harmony. No statement exists in a vacuum. If you change a number on one, it ripples through the others like a stone thrown into a pond. This is why “creative accounting” is so difficult to hide from a trained eye.
Here is how the connection works:
- Net Income Link: The Net Income from the bottom of the Income Statement flows into the “Retained Earnings” section of the Balance Sheet and serves as the starting point for the “Operating Cash Flow” section of the Cash Flow Statement.
- Depreciation Link: Depreciation is an expense on the Income Statement that reduces profit, but it is a “non-cash” item. Therefore, it is added back in the Cash Flow Statement. Simultaneously, it reduces the value of assets on the Balance Sheet.
- Working Capital Link: Changes in current assets and liabilities (like Inventory or Accounts Payable) on the Balance Sheet are reflected as cash inflows or outflows on the Cash Flow Statement.
But that’s not all. This interconnectivity is the primary reason why auditors can verify the accuracy of a company’s financial health. If the numbers don’t tie out, there is a fundamental error or, worse, intentional fraud.
6. Strategic Decision Making: Turning Data into Action
Why do CEOs care about these documents? It’s not just for regulatory compliance. These statements are the primary instruments for strategic navigation. Let’s look at three common corporate scenarios where these statements dictate the path forward.
Scenario A: Capital Expenditure (CapEx) Planning
When a company wants to build a new factory, it looks at the Cash Flow Statement to see if it has enough cash from operations to fund the project or if it needs to go to the Balance Sheet to leverage more debt. The projected depreciation of the new factory will then impact the future Income Statements by reducing taxable income.
Scenario B: Mergers and Acquisitions (M&A)
Acquirers look at the target’s Balance Sheet to evaluate hidden liabilities and the Income Statement to assess the potential for synergy and earnings growth. However, they rely on the Cash Flow Statement to calculate the “Free Cash Flow” (FCF), which is the ultimate metric for valuing a business.
7. Ratio Analysis: Reading Between the Lines
Raw numbers are informative, but ratios are transformative. Ratios allow executives to compare their performance against competitors and industry benchmarks. They turn absolute values into relative insights.
| Ratio Category | Example Ratio | Formula | What it Tells You |
|---|---|---|---|
| Liquidity | Current Ratio | Current Assets / Current Liabilities | Can the company pay its short-term debts? |
| Profitability | ROE (Return on Equity) | Net Income / Shareholders’ Equity | How efficiently is management using investor money? |
| Leverage | Debt-to-Equity | Total Liabilities / Total Equity | How much of the company is funded by debt vs. owners? |
| Efficiency | Inventory Turnover | COGS / Average Inventory | How many times a year does the company sell its stock? |
By monitoring these ratios over time, a CFO can spot trends before they become crises. For instance, a declining Inventory Turnover ratio often suggests that a company is struggling to sell its products, leading to future write-downs on the Income Statement.
8. The “EBITDA Trap” and Why Net Income Isn’t Everything
Many young entrepreneurs and investors focus exclusively on EBITDA (Earnings Before Interest, Taxes, Depreciation, and Amortization). They argue it shows the “pure” operational cash power. While EBITDA is a useful metric, relying on it solely can be fatal. This is what we call the “EBITDA Trap.”
The problem with EBITDA is that it ignores the cost of capital (interest) and the necessity of replacing aging equipment (depreciation). A company with high EBITDA but massive debt might still be heading toward insolvency if its interest payments exceed its operating cash flow. This is why the Cash Flow Statement is the ultimate “truth-teller” in finance.
9. Global Perspectives: International Financial Reporting Standards (IFRS)
In a globalized economy, financial statements must speak a common language. For companies operating in or expanding into international markets, such as Turkey, the transition to IFRS (International Financial Reporting Standards) is crucial. These standards ensure that a Balance Sheet in Istanbul is comparable to one in London or New York.
The complexity of inflation accounting and currency fluctuations adds another layer to these statements. For instance, in high-inflation environments, the “historical cost” recorded on the Balance Sheet for land or buildings might be significantly lower than its current market value, leading to “hidden reserves.” Understanding these local nuances is what separates expert investors from the rest.
10. The Future of Financial Reporting: AI and Real-Time Data
We are moving away from the era of “Monthly Closings” and toward “Continuous Accounting.” With the integration of AI and ERP systems, the three financial statements are becoming dynamic, real-time dashboards rather than static quarterly documents.
Here is what the future holds:
- Automated Reconciliation: AI algorithms that instantly match bank statements with ledgers, reducing the risk of human error in the Cash Flow Statement.
- Predictive Balance Sheets: Using machine learning to forecast future liquidity positions based on market trends and historical payment cycles.
- ESG Integration: Future financial statements will likely include Environmental, Social, and Governance (ESG) metrics alongside traditional dollar values, reflecting a company’s sustainable value.
As these technologies evolve, the fundamental logic of the three financial statements remains the same. The tools change, but the principles of profitability, stability, and liquidity are eternal.
Conclusion: Mastering the Financial Trinity
Understanding the three main financial statements is not a task reserved for accountants; it is a mandatory skill for any business leader. The Income Statement reveals your performance, the Balance Sheet reveals your foundation, and the Cash Flow Statement reveals your survival capacity. Together, they form the “Financial Trinity” that provides the clarity needed to make high-stakes corporate decisions.
Whether you are looking to optimize your internal operations, attract international investors, or prepare for a major acquisition, these documents are your roadmap. Ignoring them is like flying a plane in the dark without instruments. Mastering them, however, gives you the foresight to navigate any economic storm.
Are you ready to elevate your corporate financial strategy? At our consultancy, we specialize in helping organizations refine their financial reporting and strategic planning. Let us help you turn your financial data into a competitive advantage.
Contact Our Financial Experts Today
Discover more from Kurums | Business Intelligence
Subscribe to get the latest posts sent to your email.